HOT TOPICS LIST
- MACD
- Fibonacci
- RSI
- Gann
- ADXR
- Stochastics
- Volume
- Triangles
- Futures
- Cycles
- Volatility
- ZIGZAG
- MESA
- Retracement
- Aroon
INDICATORS LIST
LIST OF TOPICS
PRINT THIS ARTICLE
by Paolo Pezzutti
An impulse to the downside indicates the possibility of lower prices in the medium term.
Position: Sell
Paolo Pezzutti
Author of the book "Trading the US Markets - A Comprehensive Guide to US Markets for International Traders and Investors" - Harriman House (July 2008)
PRINT THIS ARTICLE
CURRENCY TRADING
USD/JPY: Consolidation Of Prices Ahead
12/27/05 11:48:21 AMby Paolo Pezzutti
An impulse to the downside indicates the possibility of lower prices in the medium term.
Position: Sell
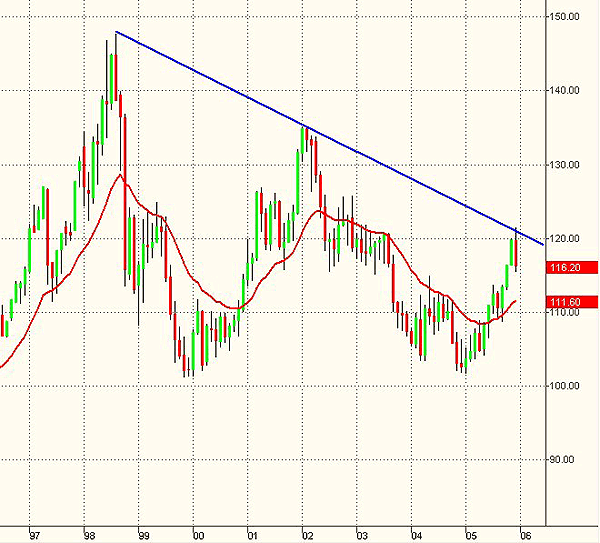
| During the past 10 years, the US dollar/Japanese yen (USD/JPY) has been printing a descending triangle. In Figure 1, you can see the big swings that characterize this formation. The pattern is bounded by two trendlines, the bottom one horizontal and the top one sloping down, intersecting at the triangle apex. Statistics say that the reliability of this pattern is quite high. Commonly, you either trade the breakout of the triangle base or the pullback after the breakout to increase the probabilities of success. Note that prices are now testing the upper negative trendline. So far, this month-by-month bar is providing the signal for a possible top reversal, showing that the bears are trying to take over from the bulls. In this time frame, with limited risk, it would be possible to open a short position aiming at the return of prices toward the triangle base around the 100 level or at least toward the moving average of prices. |

|
| FIGURE 1: USD/JPY, MONTHLY. In the US dollar/Japanese yen monthly chart, prices are testing the descending trendline. |
| Graphic provided by: TradeStation. |
| |
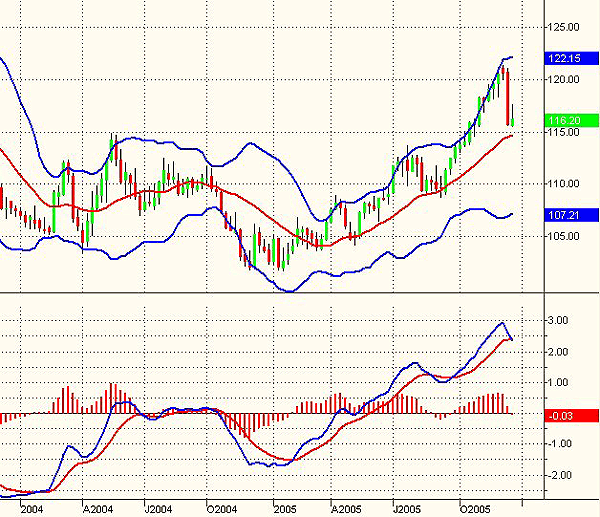
| In Figure 2, the weekly chart displays the nice uptrend developed during the past year, bringing prices from a low of 101 in January 2005 to the high of about 121 printed only two weeks ago in December 2005. Note that at the beginning of January 2005, the MacDiff (red histogram) printed a positive divergence on the double low that started the uptrend. Since then, the moving average convergence/divergence (MACD) indicator confirmed the uptrend throughout the movement. The bar printed two weeks ago is a wide-ranging one. Its range testifies the widest expansion to the downside since 2002. It places a fundamental resistance to future upmoves and signals that the bears are strongly willing to push prices down. The MACD has turned down and is about to cross its moving average. The Bollinger Bands have started to converge, indicating, at least temporarily, the end of the upmove. Prices are about to test their moving average. In these conditions, a downtrend may not begin right away. It is possible to see a sideways consolidation of prices before the next move develops. |

|
| FIGURE 2: USD/JPY, WEEKLY. The weekly chart displays the last year's uptrend. |
| Graphic provided by: TradeStation. |
| |
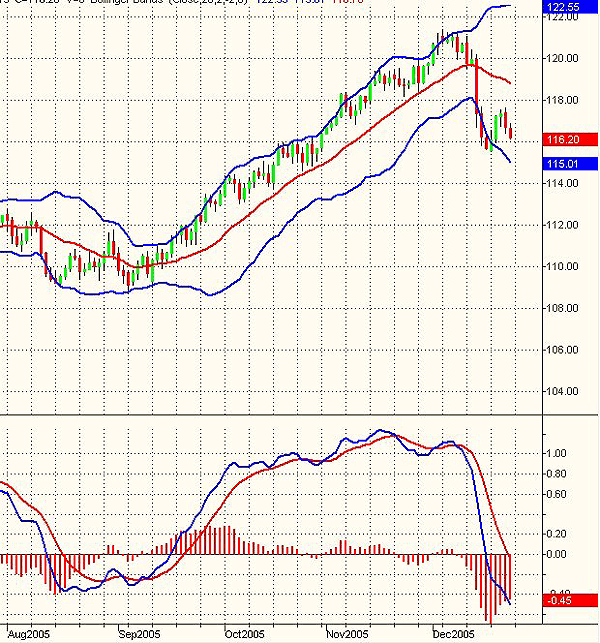
| In Figure 3, the daily chart shows even more clearly what is happening to the USD/JPY. The negative divergence printed at the beginning of December associated to the fast expansion of prices to the downside signaled the end of the uptrend. Bollinger Bands opened to indicate the increase of volatility in the direction of the new trend. In addition, the MacDiff histogram printed a new peak. After a pullback, prices are now trying to test their recent lows. Besides possible short-term consolidations, in this time frame we should see lower prices in the future. |

|
| FIGURE 3: USD/JPY, DAILY. In the daily time frame, an impulse to the downside is being printed. |
| Graphic provided by: TradeStation. |
| |
| This asset is of real interest to traders and investors. You could build your strategy on different time frames and objectives. At the monthly level, you could aim at the retest of the descending triangle base or at least of the moving average of prices, while at the weekly level, there is a possibility to see at least a period of consolidation. It is premature to say that a downtrend is ongoing. However, the risk-reward assessment indicates the possibility of good returns should the negative scenario develop. |
Author of the book "Trading the US Markets - A Comprehensive Guide to US Markets for International Traders and Investors" - Harriman House (July 2008)
| Address: | VIA ROBERTO AGO 26 POSTAL CODE 00166 |
| Rome, ITALY | |
| Phone # for sales: | +393357540708 |
| E-mail address: | pezzutti.paolo@tiscali.it |
Click here for more information about our publications!
Comments
Date: 12/30/05Rank: 3Comment:
Date: 01/03/06Rank: 4Comment:

Request Information From Our Sponsors
- VectorVest, Inc.
- Executive Premier Workshop
- One-Day Options Course
- OptionsPro
- Retirement Income Workshop
- Sure-Fire Trading Systems (VectorVest, Inc.)
- Trading as a Business Workshop
- VectorVest 7 EOD
- VectorVest 7 RealTime/IntraDay
- VectorVest AutoTester
- VectorVest Educational Services
- VectorVest OnLine
- VectorVest Options Analyzer
- VectorVest ProGraphics v6.0
- VectorVest ProTrader 7
- VectorVest RealTime Derby Tool
- VectorVest Simulator
- VectorVest Variator
- VectorVest Watchdog
- StockCharts.com, Inc.
- Candle Patterns
- Candlestick Charting Explained
- Intermarket Technical Analysis
- John Murphy on Chart Analysis
- John Murphy's Chart Pattern Recognition
- John Murphy's Market Message
- MurphyExplainsMarketAnalysis-Intermarket Analysis
- MurphyExplainsMarketAnalysis-Visual Analysis
- StockCharts.com
- Technical Analysis of the Financial Markets
- The Visual Investor
