

HOT TOPICS LIST
- MACD
- Fibonacci
- RSI
- Gann
- ADXR
- Stochastics
- Volume
- Triangles
- Futures
- Cycles
- Volatility
- ZIGZAG
- MESA
- Retracement
- Aroon
INDICATORS LIST
LIST OF TOPICS
PRINT THIS ARTICLE
by Kanwaljit Singh Mauj
After a dream run from a mere $7 to $22 in just four months, Rediff.com still shows no signs of a slowdown.
Position: Hold
Kanwaljit Singh Mauj
He is a technical analyst based in Delhi, India, a post-graduate from the Indian Institute of Capital Markets (formerly the UTI Institute of Capital Markets), Mumbai. He follows the Indian markets as well the US markets very closely. He has been active in the capital markets for the past five years.
He is an associate with AGIP Securities, which specializes in money management, index futures, live chat for daytraders, and independent technical analysis consultancy. The company has a big media presence from the likes of CNBC, NDTV Profit, and ZEE Business.
PRINT THIS ARTICLE
GAPS
Runaway Gap At Rediff: Exhaustion Of A Rally?
12/27/05 11:29:22 AMby Kanwaljit Singh Mauj
After a dream run from a mere $7 to $22 in just four months, Rediff.com still shows no signs of a slowdown.
Position: Hold
| When the low of the current bar is higher than the high of the previous bar, a gap is formed. Gaps on a chart are a very common occurrence, and they are nothing but a pictorial presentation of the difference between the demand and supply between two different bars. But gaps have tremendous predictive value. If a gap is formed in a falling market, they tend to act as a resistance. Similarly in a rising market, these same gaps form support for a price increase. These gaps indicate that the difference in demand and supply still exists. |
|
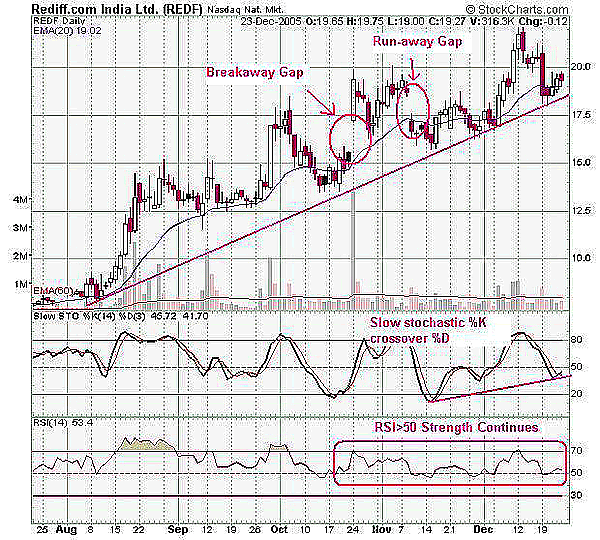
| FIGURE 1: REDIFF. Here, a breakaway gap occurred away from the congestion pattern, accompanied by high volume. |
| Graphic provided by: StockCharts.com. |
| |
| In Figure 1, the breakaway gap occurred away from the congestion pattern, accompanied by high volume. This pattern has a greater implication, as a significant move follows thereafter. In addition, these gaps tend to be filled after a long time. Further, the breakaway gap is followed with a runaway gap. This gap is normally found in the middle of a big rise or a fall in the market -- the former being the case here. They normally accelerate the process of the rise. Sometimes, more than one gap develops during the rise (but not in this case). These gaps should be treated with care and caution, as they may be the signs of an exhaustion of the rally. |
| Rediff.com is in a continuous uptrend, while a breakaway gap is supported with huge volumes followed by a runaway with no signs of exhaustion. This is also supported by a slow stochastic, which is in between the overbought (80) and oversold (20) zone. The relative strength index (>50) is also trending up, never going below 50, which is a healthy sign. It is a part of the bull trend, as it has again gone above the 20-period exponential moving average that has given a good entry point with some more steam left. |
He is a technical analyst based in Delhi, India, a post-graduate from the Indian Institute of Capital Markets (formerly the UTI Institute of Capital Markets), Mumbai. He follows the Indian markets as well the US markets very closely. He has been active in the capital markets for the past five years.
He is an associate with AGIP Securities, which specializes in money management, index futures, live chat for daytraders, and independent technical analysis consultancy. The company has a big media presence from the likes of CNBC, NDTV Profit, and ZEE Business.
| Title: | Associate |
| Company: | AGIP Securities |
| Address: | C-735A, Sushant Lok-I |
| Gurgaon, Har | |
| Phone # for sales: | 98184-72389 |
| Website: | www.ashwanigujral.com |
| E-mail address: | contact@ashwanigujral.com |
Traders' Resource Links | |
| AGIP Securities has not added any product or service information to TRADERS' RESOURCE. | |
Click here for more information about our publications!
Comments
Date:�12/29/05Rank:�5Comment:�
Date:�12/30/05Rank:�3Comment:�

Request Information From Our Sponsors
- StockCharts.com, Inc.
- Candle Patterns
- Candlestick Charting Explained
- Intermarket Technical Analysis
- John Murphy on Chart Analysis
- John Murphy's Chart Pattern Recognition
- John Murphy's Market Message
- MurphyExplainsMarketAnalysis-Intermarket Analysis
- MurphyExplainsMarketAnalysis-Visual Analysis
- StockCharts.com
- Technical Analysis of the Financial Markets
- The Visual Investor
- VectorVest, Inc.
- Executive Premier Workshop
- One-Day Options Course
- OptionsPro
- Retirement Income Workshop
- Sure-Fire Trading Systems (VectorVest, Inc.)
- Trading as a Business Workshop
- VectorVest 7 EOD
- VectorVest 7 RealTime/IntraDay
- VectorVest AutoTester
- VectorVest Educational Services
- VectorVest OnLine
- VectorVest Options Analyzer
- VectorVest ProGraphics v6.0
- VectorVest ProTrader 7
- VectorVest RealTime Derby Tool
- VectorVest Simulator
- VectorVest Variator
- VectorVest Watchdog