HOT TOPICS LIST
- MACD
- Fibonacci
- RSI
- Gann
- ADXR
- Stochastics
- Volume
- Triangles
- Futures
- Cycles
- Volatility
- ZIGZAG
- MESA
- Retracement
- Aroon
INDICATORS LIST
LIST OF TOPICS
PRINT THIS ARTICLE
by Gary Grosschadl
This unhedged intermediate-sized gold producer is based in one of the few mining-friendly, politically risk-free areas of the world.
Position: N/A
Gary Grosschadl
Independent Canadian equities trader and technical analyst based in Peterborough
Ontario, Canada.
PRINT THIS ARTICLE
CHART ANALYSIS
Agnico-Eagle Flying Higher
12/27/05 08:43:55 AMby Gary Grosschadl
This unhedged intermediate-sized gold producer is based in one of the few mining-friendly, politically risk-free areas of the world.
Position: N/A
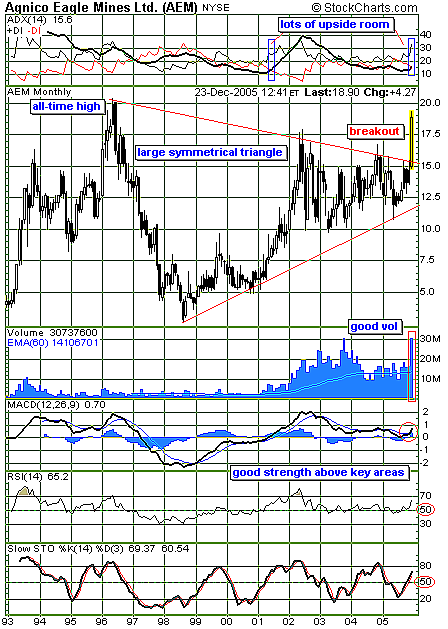
| As this monthly chart (Figure 1) shows, a breakout on good volume is under way. Of course, on the shorter-term daily and weekly charts, this has been an ongoing event. When a long-term chart confirms the move, however, a bigger play is indicated. |
| On this multiyear chart from 1993, a large symmetrical triangle is shown and a breakout is in progress. Should this move continue, the upside measure can be equal to the widest part of the triangle, roughly $14 (18-4). This hints at a possible move to $29 (15+14). |

|
| FIGURE 1: AEM. Here's a long-term monthly chart of Canadian gold producer Agnico-Eagle Mines. |
| Graphic provided by: StockCharts.com. |
| |
| Several indicators share this bold view. At the top of the chart, the directional movement indicator with its three components shows bullish promise. Note the resemblance to back in 2001, when the average directional index (ADX) upticked from below 20 to a peak of 40. The indicators below the chart all show bulish strength above key areas. The moving average convergence/divergence (MACD) indicator depicts a bullish crossover above the zero line, pointing to a bullish uptrend. Meanwhile, the relative strength index (RSI) and the stochastics oscillator both show a move above the often-key area of 50. |
| A move to the bold target of $29 would most likely be accompanied by continuing strength in the price of gold. This has already seen a spike to $540. Can this be eclipsed? |
Independent Canadian equities trader and technical analyst based in Peterborough
Ontario, Canada.
| Website: | www.whatsonsale.ca/financial.html |
| E-mail address: | gwg7@sympatico.ca |
Click here for more information about our publications!
Comments
Date: 12/27/05Rank: 5Comment:

Request Information From Our Sponsors
- StockCharts.com, Inc.
- Candle Patterns
- Candlestick Charting Explained
- Intermarket Technical Analysis
- John Murphy on Chart Analysis
- John Murphy's Chart Pattern Recognition
- John Murphy's Market Message
- MurphyExplainsMarketAnalysis-Intermarket Analysis
- MurphyExplainsMarketAnalysis-Visual Analysis
- StockCharts.com
- Technical Analysis of the Financial Markets
- The Visual Investor
- VectorVest, Inc.
- Executive Premier Workshop
- One-Day Options Course
- OptionsPro
- Retirement Income Workshop
- Sure-Fire Trading Systems (VectorVest, Inc.)
- Trading as a Business Workshop
- VectorVest 7 EOD
- VectorVest 7 RealTime/IntraDay
- VectorVest AutoTester
- VectorVest Educational Services
- VectorVest OnLine
- VectorVest Options Analyzer
- VectorVest ProGraphics v6.0
- VectorVest ProTrader 7
- VectorVest RealTime Derby Tool
- VectorVest Simulator
- VectorVest Variator
- VectorVest Watchdog
