HOT TOPICS LIST
- MACD
- Fibonacci
- RSI
- Gann
- ADXR
- Stochastics
- Volume
- Triangles
- Futures
- Cycles
- Volatility
- ZIGZAG
- MESA
- Retracement
- Aroon
INDICATORS LIST
LIST OF TOPICS
PRINT THIS ARTICLE
by David Penn
As negative divergences mount, one of Google's biggest fans steps closer to the exit.
Position: N/A
David Penn
Technical Writer for Technical Analysis of STOCKS & COMMODITIES magazine, Working-Money.com, and Traders.com Advantage.
PRINT THIS ARTICLE
TREND-CHANNEL
Googleplexed?
12/21/05 01:39:09 PMby David Penn
As negative divergences mount, one of Google's biggest fans steps closer to the exit.
Position: N/A
| Anybody notice any pigs flying lately? Or hear of any snowstorm warnings in Hell? Just wondering. After all, Jim Cramer just used the word "sell" in the same sentence as the word "Google." |
| "We hit my price target of $450 and I'm declaring victory," is specifically how Cramer, founder of TheStreet.com and host of one of the most watchable shows on cable, Mad Money, made his announcement. No fanfare, no entertaining preamble. Just a question from a caller and an answer from the host: ring the register. |

|
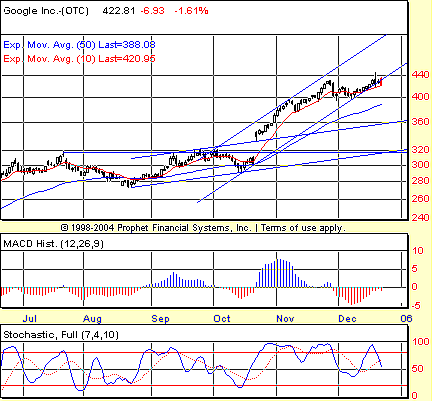
| FIGURE 1: GOOGLE, DAILY. After breaking out into a new, more bullish trend channel in mid-October, GOOG finds itself slipping below the lower boundary of that trend channel in late December. |
| Graphic provided by: Prophet Financial, Inc. |
| |
| Knowing that Cramer is no chartist means that the picture in Figure 1 holds little weight in whatever analysis he has done that convinced him that this would be a good time for those who have invested in Google (GOOG) over the past few months to begin reaping what they have sown. I was cautious about GOOG recently in an article for Traders.com Advantage earlier this month ("Meet Google's Histogram," December 8, 2005), warning that a negative divergence in the moving average convergence/divergence (MACD) histogram (and a very near-miss negative divergence in the stochastic) were factors that were likely signaling softer prices for Google going forward. |
| In the days since, Google has meandered sideways and, of late, tried to make a move higher. That move failed on December 19 and, instead, opened the door for not only additional negative divergences in the MACD histogram and stochastic, but also for a 2B (Victor Sperandeo) or Turtle Soup (Larry Connors) reversal. |
| Google is still trading well. It continues to trade above its 10-day exponential moving average (EMA) -- a moving average that is often a make-or-break level for the momentum crowd. It is also significantly above its 50-day EMA. But Google has also showed weakness -- not only in its negative divergences, but in the way it has slipped below the lower boundary of its secondary trend channel. Whether or not you believe that Google has a lot further to fall or more upside, it is hard to fault those who have profited from Google's advance thus far for turning those paper profits into profits "in pocket." |
Technical Writer for Technical Analysis of STOCKS & COMMODITIES magazine, Working-Money.com, and Traders.com Advantage.
| Title: | Technical Writer |
| Company: | Technical Analysis, Inc. |
| Address: | 4757 California Avenue SW |
| Seattle, WA 98116 | |
| Phone # for sales: | 206 938 0570 |
| Fax: | 206 938 1307 |
| Website: | www.Traders.com |
| E-mail address: | DPenn@traders.com |
Traders' Resource Links | |
| Charting the Stock Market: The Wyckoff Method -- Books | |
| Working-Money.com -- Online Trading Services | |
| Traders.com Advantage -- Online Trading Services | |
| Technical Analysis of Stocks & Commodities -- Publications and Newsletters | |
| Working Money, at Working-Money.com -- Publications and Newsletters | |
| Traders.com Advantage -- Publications and Newsletters | |
| Professional Traders Starter Kit -- Software | |
Click here for more information about our publications!
Comments
Date: 12/22/05Rank: 4Comment:

Request Information From Our Sponsors
- VectorVest, Inc.
- Executive Premier Workshop
- One-Day Options Course
- OptionsPro
- Retirement Income Workshop
- Sure-Fire Trading Systems (VectorVest, Inc.)
- Trading as a Business Workshop
- VectorVest 7 EOD
- VectorVest 7 RealTime/IntraDay
- VectorVest AutoTester
- VectorVest Educational Services
- VectorVest OnLine
- VectorVest Options Analyzer
- VectorVest ProGraphics v6.0
- VectorVest ProTrader 7
- VectorVest RealTime Derby Tool
- VectorVest Simulator
- VectorVest Variator
- VectorVest Watchdog
- StockCharts.com, Inc.
- Candle Patterns
- Candlestick Charting Explained
- Intermarket Technical Analysis
- John Murphy on Chart Analysis
- John Murphy's Chart Pattern Recognition
- John Murphy's Market Message
- MurphyExplainsMarketAnalysis-Intermarket Analysis
- MurphyExplainsMarketAnalysis-Visual Analysis
- StockCharts.com
- Technical Analysis of the Financial Markets
- The Visual Investor
