HOT TOPICS LIST
- MACD
- Fibonacci
- RSI
- Gann
- ADXR
- Stochastics
- Volume
- Triangles
- Futures
- Cycles
- Volatility
- ZIGZAG
- MESA
- Retracement
- Aroon
INDICATORS LIST
LIST OF TOPICS
PRINT THIS ARTICLE
by Kanwaljit Singh Mauj
Biomet appears to be on a continuous downtrend. It tested resistance at 38 but could not break through it. An evening star appears to be emerging, but further drift cannot be ruled out.
Position: Sell
Kanwaljit Singh Mauj
He is a technical analyst based in Delhi, India, a post-graduate from the Indian Institute of Capital Markets (formerly the UTI Institute of Capital Markets), Mumbai. He follows the Indian markets as well the US markets very closely. He has been active in the capital markets for the past five years.
He is an associate with AGIP Securities, which specializes in money management, index futures, live chat for daytraders, and independent technical analysis consultancy. The company has a big media presence from the likes of CNBC, NDTV Profit, and ZEE Business.
PRINT THIS ARTICLE
CANDLESTICK CHARTING
Biomet Drifting South
12/21/05 10:40:54 AMby Kanwaljit Singh Mauj
Biomet appears to be on a continuous downtrend. It tested resistance at 38 but could not break through it. An evening star appears to be emerging, but further drift cannot be ruled out.
Position: Sell
| A star is a three-candlestick pattern and usually has more significance after a rally or a fall. A star is a small real body gapping away from the large real body preceding it. It is a stalemate between the bulls and the bears and implies that the previous trend may change or reverse. The color of the real body of the star is not important. A doji star reflects a clear stalemate and so has a strong significance. The morning star, in contrast, belongs to the category of trend reversals and is a harder pattern to pick. In the study of trend reversals, three candlesticks are generally taken into consideration, forming a group that can indicate a possible reversal. |
| In a group of three candles, a white real body is followed by a small real body that gaps up on the second day. On the third day, a black body is formed, penetrating well into the first real body. The significance of the pattern increases if the real body gaps up and closes well within the real body of the first candlestick: the more the penetration, the greater its significance. If the volume on the third day is greater than the volume on the previous two days, chances become greater of the trend changing. See Figure 1. |
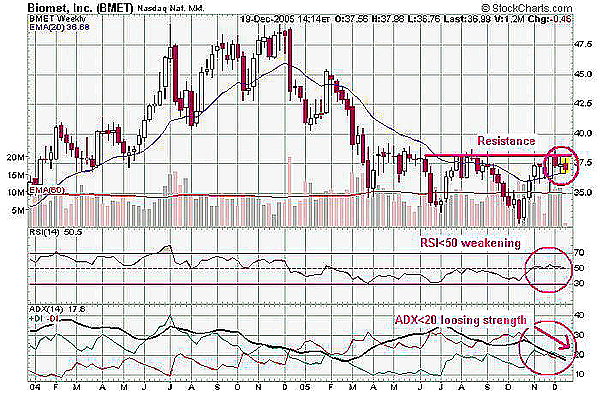
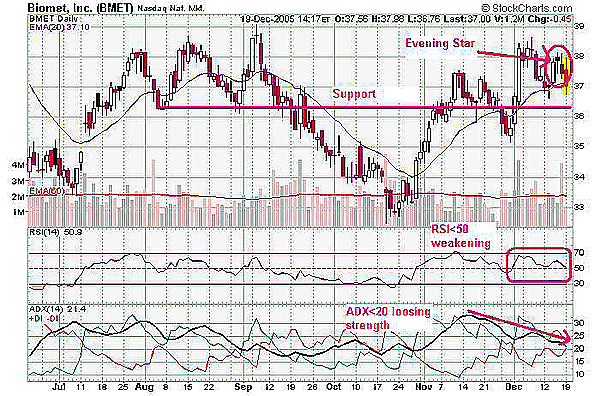
| The weekly chart is suggesting an inverted head & shoulder formation, in which the stock has tried to cross its resistance level of 38. On top of it, an evening star has emerged, suggesting it will be difficult to surpass its resistance level. The relative strength index (RSI) is weakening -- that is, less than the 50 level -- as is the average directional movement index (ADX), which has gone below the 20 level, indicating that the trend has reversed. For confirmation see Figure 2, which is a six-month daily chart. |

|
| FIGURE 1: BMET, WEEKLY. The ADX and RSI both are weakening, indicating that the trend has reversed. |
| Graphic provided by: StockCharts.com. |
| |
| Figure 1 confirms the study of a trend reversal, with the evening star formation visible. The RSI is weakening -- with levels below 50 -- and so has ADX, which is also heading south, below 20. The stock should find support at around the 36 level. |

|
| FIGURE 2: BMET, SIX-MONTH DAILY. This chart appears to confirm the trend reversal. |
| Graphic provided by: StockCharts.com. |
| |
| Evening star formations can be useful in determining trend changes, particularly when used with other indicators. Volume also plays an important part in confirming the trend reversal. |
He is a technical analyst based in Delhi, India, a post-graduate from the Indian Institute of Capital Markets (formerly the UTI Institute of Capital Markets), Mumbai. He follows the Indian markets as well the US markets very closely. He has been active in the capital markets for the past five years.
He is an associate with AGIP Securities, which specializes in money management, index futures, live chat for daytraders, and independent technical analysis consultancy. The company has a big media presence from the likes of CNBC, NDTV Profit, and ZEE Business.
| Title: | Associate |
| Company: | AGIP Securities |
| Address: | C-735A, Sushant Lok-I |
| Gurgaon, Har | |
| Phone # for sales: | 98184-72389 |
| Website: | www.ashwanigujral.com |
| E-mail address: | contact@ashwanigujral.com |
Traders' Resource Links | |
| AGIP Securities has not added any product or service information to TRADERS' RESOURCE. | |
Click here for more information about our publications!
Comments
Date: 12/21/05Rank: 5Comment:
Date: 12/22/05Rank: 4Comment:
Date: 12/23/05Rank: 5Comment:
Date: 12/25/05Rank: 5Comment:
Date: 12/27/05Rank: 5Comment:

Request Information From Our Sponsors
- StockCharts.com, Inc.
- Candle Patterns
- Candlestick Charting Explained
- Intermarket Technical Analysis
- John Murphy on Chart Analysis
- John Murphy's Chart Pattern Recognition
- John Murphy's Market Message
- MurphyExplainsMarketAnalysis-Intermarket Analysis
- MurphyExplainsMarketAnalysis-Visual Analysis
- StockCharts.com
- Technical Analysis of the Financial Markets
- The Visual Investor
- VectorVest, Inc.
- Executive Premier Workshop
- One-Day Options Course
- OptionsPro
- Retirement Income Workshop
- Sure-Fire Trading Systems (VectorVest, Inc.)
- Trading as a Business Workshop
- VectorVest 7 EOD
- VectorVest 7 RealTime/IntraDay
- VectorVest AutoTester
- VectorVest Educational Services
- VectorVest OnLine
- VectorVest Options Analyzer
- VectorVest ProGraphics v6.0
- VectorVest ProTrader 7
- VectorVest RealTime Derby Tool
- VectorVest Simulator
- VectorVest Variator
- VectorVest Watchdog
