HOT TOPICS LIST
- MACD
- Fibonacci
- RSI
- Gann
- ADXR
- Stochastics
- Volume
- Triangles
- Futures
- Cycles
- Volatility
- ZIGZAG
- MESA
- Retracement
- Aroon
INDICATORS LIST
LIST OF TOPICS
PRINT THIS ARTICLE
by David Penn
Another new low in the CBOE Volatility Index suggests the market is in the mood for a move higher.
Position: N/A
David Penn
Technical Writer for Technical Analysis of STOCKS & COMMODITIES magazine, Working-Money.com, and Traders.com Advantage.
PRINT THIS ARTICLE
VOLATILITY
Vexing $VIX Breakdown
12/16/05 02:13:06 PMby David Penn
Another new low in the CBOE Volatility Index suggests the market is in the mood for a move higher.
Position: N/A
| The alternative title to this article was, "Or How I Learned To Stop Worrying And Buy The Calls." |
| I wonder if many of those traders and stock market observers who were complaining in recent months and years that the CBOE Volatility Index ($VIX) "no longer worked" were just put buyers talking their increasingly in-the-red book. |

|
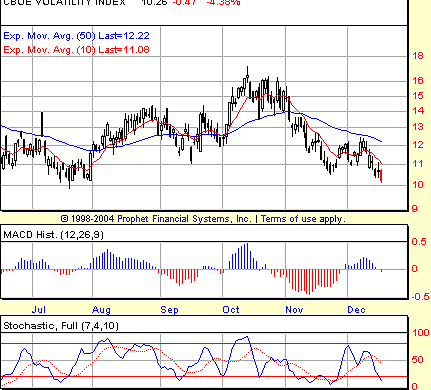
| FIGURE 1: CBOE VOLATILITY INDEX, DAILY. A negative divergence in the stochastic points to new lows in the $VIX -- and new highs in the stock market. |
| Graphic provided by: Prophet Financial, Inc. |
| |
| Before pressing the bearish case for the $VIX (which is a bullish case for stocks, of course), I should point out that the last time the $VIX was this low was back in mid-July. At the time, the markets were making new highs for the year as part of a recovery from an early 2005 decline that began shortly after the beginning of the year. And it is worth remembering that the most telling (and rewarding) signals in the $VIX are buy signals when the $VIX is "too high" and sell signals when the $VIX is "too low." Unfortunately, "too high" and "too low" are far easier to mark in hindsight than they are in real-time. And as I've pointed out recently, legendary trader Jesse Livermore might never have been more correct when he warned, "Stocks are never too high to buy and never too low to sell" (see my Working-Money.com article "BOSO," October 5, 2005). This might be worth remembering insofar as the low level in the $VIX might encourage some to believe that the downside in the volatility index -- and the upside in stocks -- are limited. |
| The $VIX made a negative stochastic divergence during its most recent bounce from the November lows. This bounce in the $VIX coincided with the softness in the market during the post-Thanksgiving/pre-December quadruple witching period ("quadruple witching" refers to the same-day expiration of futures, options on futures, options, and single stock futures). And the mildness of the $VIX bounce was no less apparent in the mildness of the stock market's correction -- which in most cases failed even to retrace as much as 38.2% of the rally from the October lows. |
| It is this negative stochastic divergence that is responsible for the $VIX's new five-month low. At the same time, it is worth noting that, as the chart of the $VIX in Figure 1 shows, there is ample room for the $VIX to fall from current levels without necessarily creating a lower low in either the MACD histogram or the stochastic. Such an event would set up a positive divergence -- and the opportunity for a higher $VIX and a lower stock market. |
Technical Writer for Technical Analysis of STOCKS & COMMODITIES magazine, Working-Money.com, and Traders.com Advantage.
| Title: | Technical Writer |
| Company: | Technical Analysis, Inc. |
| Address: | 4757 California Avenue SW |
| Seattle, WA 98116 | |
| Phone # for sales: | 206 938 0570 |
| Fax: | 206 938 1307 |
| Website: | www.Traders.com |
| E-mail address: | DPenn@traders.com |
Traders' Resource Links | |
| Charting the Stock Market: The Wyckoff Method -- Books | |
| Working-Money.com -- Online Trading Services | |
| Traders.com Advantage -- Online Trading Services | |
| Technical Analysis of Stocks & Commodities -- Publications and Newsletters | |
| Working Money, at Working-Money.com -- Publications and Newsletters | |
| Traders.com Advantage -- Publications and Newsletters | |
| Professional Traders Starter Kit -- Software | |
Click here for more information about our publications!
Comments
Date: 12/16/05Rank: 3Comment:
Date: 12/20/05Rank: 5Comment:
Date: 12/20/05Rank: 5Comment: As always, David is very educational and very clear in his writing, so that a person such as myself can learn from the article. I now need to work on not being rude and cranky, but that is another topic.
Date: 12/27/05Rank: 3Comment:

Request Information From Our Sponsors
- StockCharts.com, Inc.
- Candle Patterns
- Candlestick Charting Explained
- Intermarket Technical Analysis
- John Murphy on Chart Analysis
- John Murphy's Chart Pattern Recognition
- John Murphy's Market Message
- MurphyExplainsMarketAnalysis-Intermarket Analysis
- MurphyExplainsMarketAnalysis-Visual Analysis
- StockCharts.com
- Technical Analysis of the Financial Markets
- The Visual Investor
- VectorVest, Inc.
- Executive Premier Workshop
- One-Day Options Course
- OptionsPro
- Retirement Income Workshop
- Sure-Fire Trading Systems (VectorVest, Inc.)
- Trading as a Business Workshop
- VectorVest 7 EOD
- VectorVest 7 RealTime/IntraDay
- VectorVest AutoTester
- VectorVest Educational Services
- VectorVest OnLine
- VectorVest Options Analyzer
- VectorVest ProGraphics v6.0
- VectorVest ProTrader 7
- VectorVest RealTime Derby Tool
- VectorVest Simulator
- VectorVest Variator
- VectorVest Watchdog
