HOT TOPICS LIST
- MACD
- Fibonacci
- RSI
- Gann
- ADXR
- Stochastics
- Volume
- Triangles
- Futures
- Cycles
- Volatility
- ZIGZAG
- MESA
- Retracement
- Aroon
INDICATORS LIST
LIST OF TOPICS
PRINT THIS ARTICLE
by David Penn
The Dow transports fashioned a bull flag of their own over the November-December period and look to head higher.
Position: N/A
David Penn
Technical Writer for Technical Analysis of STOCKS & COMMODITIES magazine, Working-Money.com, and Traders.com Advantage.
PRINT THIS ARTICLE
FLAGS AND PENNANTS
Transports Climb Toward Breakout Mountain
12/16/05 09:26:31 AMby David Penn
The Dow transports fashioned a bull flag of their own over the November-December period and look to head higher.
Position: N/A
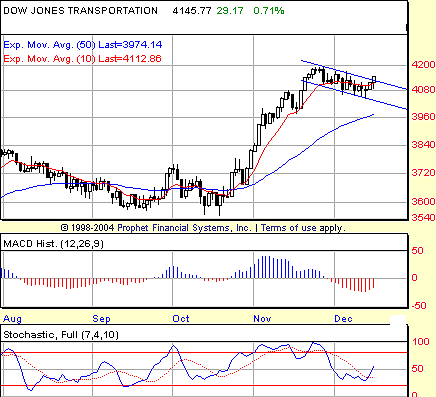
| The pattern that has been developing in the Dow transports over the past month is one that can be seen in the Dow industrials as well. That pattern is a bull flag and it is created when, after an uptrend, prices begin to move sideways with a slight bias to the downside. Generally, no significantly lower lows are created during the bull flag, which also tends to be relatively short in duration. The product of bull flags typically is a rally -- often a rally as powerful as the one that preceded the bull flag, making these technical chart patterns worth watching when they appear (Figure 1). |
Writing about flags in his must-own compendium of chart patterns, Encyclopedia Of Chart Patterns, Thomas Bulkowski notes: Small flags appear like road kill along the price highway. You find them in a fast moving price trend, one that zips several points in just a few days. Price pauses at the flag, and then continues in the same direction as before encountering the flag. That behavior is not always the case, of course, as price reversals abound, so you should wait for the breakout to be sure. |

|
| FIGURE 1: DOW TRANSPORTS, DAILY. After a sharp rally in November, the Dow transports consolidate by way of a bullish flag. As the transports appear to be breaking out, note how both the stochastic and the MACD histogram are rounding upward. |
| Graphic provided by: Prophet Financial, Inc. |
| |
| Bulkowski goes on to spell out the criteria for a true flag pattern, and it appears as if the potential flag pattern in the transports fits the criteria to a T. "Prices bound by two trendlines"? Check. "Three-week maximum" duration? Check. "Steep, quick price trend" preceding the flag pattern? Check and double-check. If there is anything missing, then it might be what Bulkowski calls a "downward volume trend" over the course of the pattern. The transports in Figure 1 does not show volume. But anecdotally, I can say that volume has been unspectacular over the past few weeks, as the markets in general have performed relatively listlessly. |
| How far have transports progressed up "breakout mountain"? Thursday's close (December 15) appears to have poked the transports out above the upper boundary of the flag formation. Follow-through to the upside will, of course, be critical -- though given the recent swimming-through-sand nature of the market, speculators and traders should be on guard for a session or two of sideways trading just above the breakout level. What is most interesting about the idea of a bull flag in the transports is that the measurement rule for a minimum post-breakout advance is computed by taking the magnitude of the trend leading into the flag and adding that amount to the value at the breakout level. The Dow transports have rallied from a low of about 3600 in October to a flag formation high of 4200 in late November. That's 600 points. Add that 600 points to the value at the breakout -- which appears to be about 4100 -- and you get a minimum upside of 4700. |
| Interestingly, Bulkowski notes that "flags with upward breakouts do well near the yearly highs." Given that the Dow transports made new, all-time highs in November and are only slightly off that mark by dint of the bull flag pullback, speculators and traders should not be surprised if that next 600 points in the Dow transports arrives very, very swiftly. |
Technical Writer for Technical Analysis of STOCKS & COMMODITIES magazine, Working-Money.com, and Traders.com Advantage.
| Title: | Technical Writer |
| Company: | Technical Analysis, Inc. |
| Address: | 4757 California Avenue SW |
| Seattle, WA 98116 | |
| Phone # for sales: | 206 938 0570 |
| Fax: | 206 938 1307 |
| Website: | www.Traders.com |
| E-mail address: | DPenn@traders.com |
Traders' Resource Links | |
| Charting the Stock Market: The Wyckoff Method -- Books | |
| Working-Money.com -- Online Trading Services | |
| Traders.com Advantage -- Online Trading Services | |
| Technical Analysis of Stocks & Commodities -- Publications and Newsletters | |
| Working Money, at Working-Money.com -- Publications and Newsletters | |
| Traders.com Advantage -- Publications and Newsletters | |
| Professional Traders Starter Kit -- Software | |
Click here for more information about our publications!
Comments
Date: 12/16/05Rank: 3Comment:
Date: 12/20/05Rank: 5Comment:
Date: 12/27/05Rank: 5Comment:

Request Information From Our Sponsors
- StockCharts.com, Inc.
- Candle Patterns
- Candlestick Charting Explained
- Intermarket Technical Analysis
- John Murphy on Chart Analysis
- John Murphy's Chart Pattern Recognition
- John Murphy's Market Message
- MurphyExplainsMarketAnalysis-Intermarket Analysis
- MurphyExplainsMarketAnalysis-Visual Analysis
- StockCharts.com
- Technical Analysis of the Financial Markets
- The Visual Investor
- VectorVest, Inc.
- Executive Premier Workshop
- One-Day Options Course
- OptionsPro
- Retirement Income Workshop
- Sure-Fire Trading Systems (VectorVest, Inc.)
- Trading as a Business Workshop
- VectorVest 7 EOD
- VectorVest 7 RealTime/IntraDay
- VectorVest AutoTester
- VectorVest Educational Services
- VectorVest OnLine
- VectorVest Options Analyzer
- VectorVest ProGraphics v6.0
- VectorVest ProTrader 7
- VectorVest RealTime Derby Tool
- VectorVest Simulator
- VectorVest Variator
- VectorVest Watchdog
