HOT TOPICS LIST
- MACD
- Fibonacci
- RSI
- Gann
- ADXR
- Stochastics
- Volume
- Triangles
- Futures
- Cycles
- Volatility
- ZIGZAG
- MESA
- Retracement
- Aroon
INDICATORS LIST
LIST OF TOPICS
PRINT THIS ARTICLE
by Paolo Pezzutti
This reliable retracement pattern profits from fading the gap in a strongly trending market.
Position: N/A
Paolo Pezzutti
Author of the book "Trading the US Markets - A Comprehensive Guide to US Markets for International Traders and Investors" - Harriman House (July 2008)
PRINT THIS ARTICLE
AVE DIREC MOVE
Short-Term Pattern: ADX Gapper
12/15/05 08:23:59 AMby Paolo Pezzutti
This reliable retracement pattern profits from fading the gap in a strongly trending market.
Position: N/A
| In their well-regarded Street Smarts: High Probability Short-Term Trading Strategies, Linda Bradford Raschke and Laurence A. Connors introduced the ADX Gapper pattern. This pattern is very simple. With the "Oops" strategy, Larry Williams introduced the idea that gap reversal can be traded profitably (see my May 31, 2005, Traders.com Advantage article on the subject). Fading a gap in a strongly trending market should increase your chance of success. After a temporary weakness in the form of a down open, the market resumes its original trend. Of course, the trend filter reduces the number of trade setups. However, you have to scan your database searching for assets that meet the required conditions. |
| The indicators used by the authors are the DMI Plus and DMI Minus, and the average directional movement index (ADX). The TradeStation help reports the following information about directional movement index (DMI): "The DMI indicator calculates and plots the DMI Plus and DMI Minus values. DMI Plus is calculated from a comparison of the highs on a series of consecutive bars versus the true range; DMI Minus is calculated from the lows on a series of consecutive bars versus the true range. These values are used to calculate ADX, which is also plotted by this indicator." The ADX measures the trend quality of a security, independent of direction; the greater the ADX value, the stronger a security is trending. Traditionally, values above 30 are assumed to indicate an ongoing trend. The DMI Plus and DMI Minus components of the ADX can aid in identifying direction. DMI Plus crossing over DMI Minus is a bullish sign, and vice versa. |
| For this strategy we use a 12-period ADX and a 28-period DMI Plus/Minus. The rules of this strategy are: -ADX must be greater than 30 -For a buy setup, DMI Plus must be above DMI Minus -Today's open must gap below yesterday's low -Place a buy-stop around yesterday's low -When filled, place a stop-loss below today's low. |

|
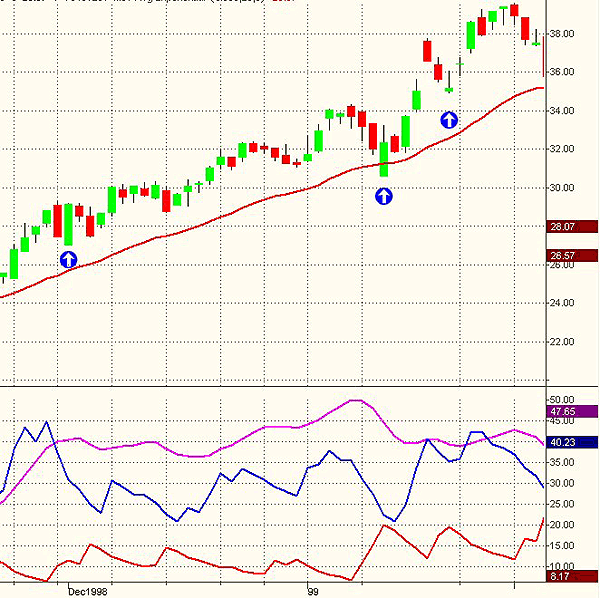
| FIGURE 1: MSFT, YEARLY. The DMI Plus above DMI Minus signaled the trend was up. With the ADX above 30, MSFT printed three successful setups in two months. |
| Graphic provided by: TradeStation. |
| |
| For sells, it is the opposite. The exit rule is the same for most short-term patterns. I would suggest using a trailing stop. You can carry the trade overnight if a strong close occurs. Let's see an example. In Figure 1, you can see that back in 1999, Microsoft (MSFT) printed a strong uptrend. In only two months, there were three valid setups. This is quite unusual. In strong trends it happens that you have weak opens, but rare that the open occurs below the previous day's low. Note that during the uptrend, the stock developed very few and short corrections. This pattern allowed long positions during these corrections with very strict control of risk, again rare! The first pattern, in December 1998, displayed a two-bar correction the day after the entry bar that printed a wide-ranging trend day. The last two patterns saw the volatility increase immediately after the entry. |
| In summary, this is another pattern to use in your short-term library. As these patterns are not very frequent, you have to be ready to trade them when they occur, scanning the database and searching for market opportunities. The excellent risk control of this type of trades will provide you some small losses before you get a big win. |
Author of the book "Trading the US Markets - A Comprehensive Guide to US Markets for International Traders and Investors" - Harriman House (July 2008)
| Address: | VIA ROBERTO AGO 26 POSTAL CODE 00166 |
| Rome, ITALY | |
| Phone # for sales: | +393357540708 |
| E-mail address: | pezzutti.paolo@tiscali.it |
Click here for more information about our publications!
Comments
Date: 12/16/05Rank: 3Comment:
Date: 12/21/05Rank: 4Comment:

Request Information From Our Sponsors
- StockCharts.com, Inc.
- Candle Patterns
- Candlestick Charting Explained
- Intermarket Technical Analysis
- John Murphy on Chart Analysis
- John Murphy's Chart Pattern Recognition
- John Murphy's Market Message
- MurphyExplainsMarketAnalysis-Intermarket Analysis
- MurphyExplainsMarketAnalysis-Visual Analysis
- StockCharts.com
- Technical Analysis of the Financial Markets
- The Visual Investor
- VectorVest, Inc.
- Executive Premier Workshop
- One-Day Options Course
- OptionsPro
- Retirement Income Workshop
- Sure-Fire Trading Systems (VectorVest, Inc.)
- Trading as a Business Workshop
- VectorVest 7 EOD
- VectorVest 7 RealTime/IntraDay
- VectorVest AutoTester
- VectorVest Educational Services
- VectorVest OnLine
- VectorVest Options Analyzer
- VectorVest ProGraphics v6.0
- VectorVest ProTrader 7
- VectorVest RealTime Derby Tool
- VectorVest Simulator
- VectorVest Variator
- VectorVest Watchdog
