HOT TOPICS LIST
- MACD
- Fibonacci
- RSI
- Gann
- ADXR
- Stochastics
- Volume
- Triangles
- Futures
- Cycles
- Volatility
- ZIGZAG
- MESA
- Retracement
- Aroon
INDICATORS LIST
LIST OF TOPICS
PRINT THIS ARTICLE
by Paolo Pezzutti
Prices could continue to move up and close the gap in the $24 area.
Position: N/A
Paolo Pezzutti
Author of the book "Trading the US Markets - A Comprehensive Guide to US Markets for International Traders and Investors" - Harriman House (July 2008)
PRINT THIS ARTICLE
REVERSAL
Pfizer: A Reversal Formation
12/16/05 01:58:24 PMby Paolo Pezzutti
Prices could continue to move up and close the gap in the $24 area.
Position: N/A
| Pfizer Inc. (PFE) announced that it was using its continuing strong cash flow from operations to increase its quarterly dividend 26 percent to 24 cents per share for the first quarter of 2006, while investing in new products and growth opportunities. The dividend increase is part of a series of actions to enhance short- and long-term returns for shareholders. The stock has recently jumped almost 9% to $22.85. The signal to the upside is strong. Are we going to have a follow-through of this move? |

|
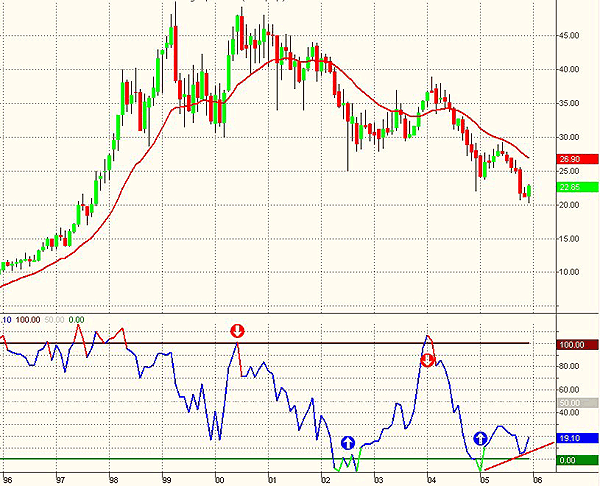
| FIGURE 1: PFIZER, DOWNTREND SINCE 2000. PFE has been in a downtrend since 2000. |
| Graphic provided by: TradeStation. |
| |
| The technical situation is interesting because the stock has developed a positive divergence in the daily, weekly, and monthly time frames. I will use the Bollinger %b (close) indicator to support this analysis. You know that %b is a useful tool to tell us where we are within the Bollinger Bands (%b=(last close-Upper Band)/(Upper Band-Lower Band). Analyst John Bollinger looked at volatility as ever-changing. The need for adaptive trading bands, and the observation that volatility was dynamic, shaped the Bollinger Bands. These characteristics make them invaluable to traders. In Figure 1, you can see the monthly chart of Pfizer. After the year 2000 top, the stock started a five-year downtrend. The stock did not participate in the last three-year upmove that is in partial recovery, so far, from the heavy losses suffered by investors between 2000 and 2002 on the markets. Note, in fact, that Pfizer from the 2000 high of about $48 lost more than 50% to the present $23 level; %b (close) signaled the big price swings that occurred during the past years. The recent December 2005 low was reached, printing a positive divergence. |

|
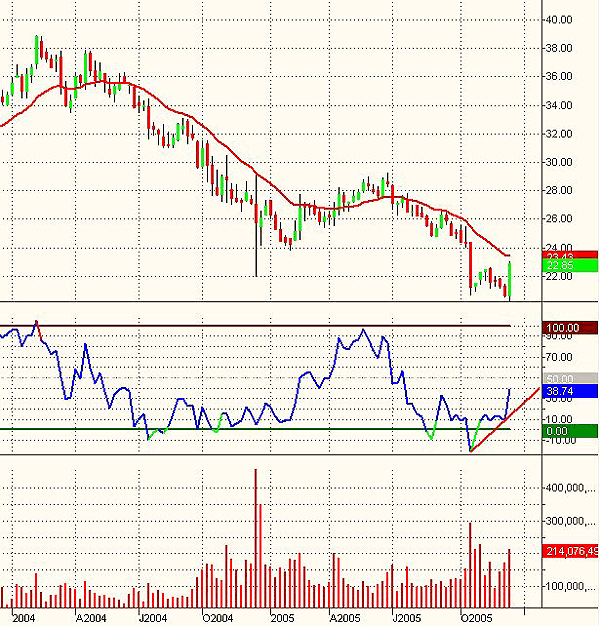
| FIGURE 2: PFIZER, WEEKLY. PFE's weekly chart displays a bullish reversal formation. |
| Graphic provided by: TradeStation. |
| |
| In Figure 2, the weekly chart displays the strong downtrend started back in 2004. Of great note is the December 17, 2004, bar. This wide-ranging bar placed a significant support. It was printed in an extremely volatile day with a record of volumes. The outcome was that prices bounced for the first six months of 2005 before moving downward again to test the lows. A new low was reached in October 2005 after a week of heavy losses for the stock. The range was big, but smaller than the one printed on the previous low. The volume was high, but lower than on the December 2004 low. Bears were not as committed as they were during last year's move to new lows. From there, prices bounced weakly to move down again. This week, prices tested the October 2005 low. The week is not finished yet, but unless we see new developments, a wide-ranging bar to the upside is putting bulls in control. The test of the previous low is failed with the %b (close) printing a significant positive divergence. |

|
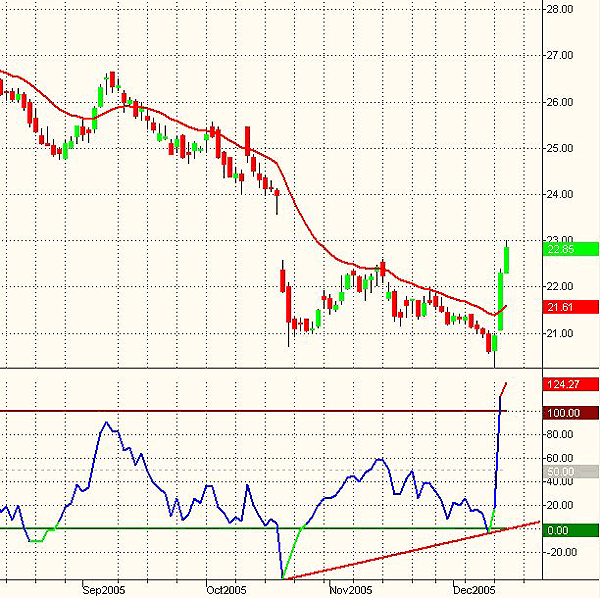
| FIGURE 3: PFIZER, DAILY. PFE displays a Turtle Soup Plus One pattern associated to a %b (close) indicator positive divergence. |
| Graphic provided by: TradeStation. |
| |
| In Figure 3, you can see the daily chart. The October 20th gap could be the last tentative to move prices downward and represent an exhaustion gap. Also in this time frame, you can see that %b (close) has printed an important divergence with the October 21st low. The December 9th and 12th sessions printed a Turtle Soup Plus One pattern (see my May 2nd article on the subject) that allowed a low-risk entry point to the upside. The last two sessions displayed two wide-ranging bars that show how the bulls are in control at the moment. |
| It is possible from these levels a short-term consolidation develops. In the long term, the technical situation is negative. We cannot say at the moment that the downtrend is over, but there are those who believe that prices could move up and close at least the open gap in the $24 area. The presence of divergences in all referenced time frames is in support of the possibility for an upleg to develop. Generally speaking, it is important to spot low-risk entry points. Risk control is probably the main aspect to take care when opening a position. One way of doing it could be to associate typical short-term patterns like Turtle Soup to a longer-term analysis that displays multiple divergences. |
Author of the book "Trading the US Markets - A Comprehensive Guide to US Markets for International Traders and Investors" - Harriman House (July 2008)
| Address: | VIA ROBERTO AGO 26 POSTAL CODE 00166 |
| Rome, ITALY | |
| Phone # for sales: | +393357540708 |
| E-mail address: | pezzutti.paolo@tiscali.it |
Click here for more information about our publications!
Comments
Date: 12/16/05Rank: 3Comment:
Date: 12/17/05Rank: 5Comment:
Date: 12/21/05Rank: 5Comment:

Request Information From Our Sponsors
- VectorVest, Inc.
- Executive Premier Workshop
- One-Day Options Course
- OptionsPro
- Retirement Income Workshop
- Sure-Fire Trading Systems (VectorVest, Inc.)
- Trading as a Business Workshop
- VectorVest 7 EOD
- VectorVest 7 RealTime/IntraDay
- VectorVest AutoTester
- VectorVest Educational Services
- VectorVest OnLine
- VectorVest Options Analyzer
- VectorVest ProGraphics v6.0
- VectorVest ProTrader 7
- VectorVest RealTime Derby Tool
- VectorVest Simulator
- VectorVest Variator
- VectorVest Watchdog
- StockCharts.com, Inc.
- Candle Patterns
- Candlestick Charting Explained
- Intermarket Technical Analysis
- John Murphy on Chart Analysis
- John Murphy's Chart Pattern Recognition
- John Murphy's Market Message
- MurphyExplainsMarketAnalysis-Intermarket Analysis
- MurphyExplainsMarketAnalysis-Visual Analysis
- StockCharts.com
- Technical Analysis of the Financial Markets
- The Visual Investor
