HOT TOPICS LIST
- MACD
- Fibonacci
- RSI
- Gann
- ADXR
- Stochastics
- Volume
- Triangles
- Futures
- Cycles
- Volatility
- ZIGZAG
- MESA
- Retracement
- Aroon
INDICATORS LIST
LIST OF TOPICS
PRINT THIS ARTICLE
by David Penn
Sticking to a single trend channel since rising from the October lows, the stocks of the NYSE ride support higher and higher.
Position: N/A
David Penn
Technical Writer for Technical Analysis of STOCKS & COMMODITIES magazine, Working-Money.com, and Traders.com Advantage.
PRINT THIS ARTICLE
TREND-CHANNEL
The NYSE Composite's Make Or Break Channel
12/15/05 07:59:54 AMby David Penn
Sticking to a single trend channel since rising from the October lows, the stocks of the NYSE ride support higher and higher.
Position: N/A
| For all the attention paid indexes and averages like the Standard & Poor's 500, the NASDAQ, and the Dow Jones industrials, I suspect that speculators and traders would be well-advised to consider adding some less eyeballed indexes to their daily or weekly market roundup. If you are interested in the smaller stocks of the NASDAQ, then why not spend a little time studying the Russell 2000? And if you prefer the breadth of coverage provided by tracking the S&P 500, then why not consider posting a chart or two of the New York Stock Exchange (NYSE)? |
| Those looking for a broader cross-section of the universe of equities need look little farther than the NYSE, or the NYSE Composite to be more specific. Consisting of more than 2,000 stocks, the NYSE covers a great deal more territory than both the S&P 500 and the Dow industrials. And with regard to stock market territory, the S&P 500 tends to be dominated by larger companies. As such, much of the growth that comes from smaller stocks is more likely to be reflected in the NYSE Composite than in the S&P 500. |

|
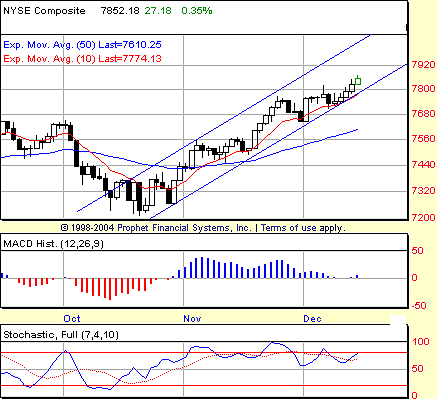
| FIGURE 1: NYSE, DAILY. Ever since bottoming in October, the NYSE Composite has rallied within a tight trend channel. In spite of growing negative divergences in both the MACD histogram and the stochastic, the NYSE Composite continues to find support at the channel’s lower boundary. |
| Graphic provided by: Prophet Financial, Inc. |
| |
| The NYSE Composite's rally from the October lows has been contained perfectly within a rising trend channel. Often, as I wrote about in a recent piece for Working-Money.com ("Stage Analysis With Trend Channels," December 7, 2005), stocks making advances often will form an initial flat-to-shallow trend channel. In breaking out above the upper boundary of such channels, stocks often then enter steeper, more dramatic inclines as they head higher. However, the case of the NYSE Composite since mid-October has been one in which "one trend channel fits all." That negative divergences have developed over the course of the advance is no reason for surprise. As the MACD histogram shows quite well in Figure 1, momentum was particularly strong early in the advance in early November, and faded progressively as the rally continued into December. As of late November, the stochastic has begun to reflect a similar pattern of waning momentum. Negative divergences are warning signs. The question is how severe a warning do they represent. I've gone back and forth on this -- from believing that negative divergences can be shorted in all instances (especially stochastic negative divergences confirmed by negative divergences in the moving average convergence/divergence [MACD] histogram) to thinking that negative divergences needed to be below a major intermediate- to long-term moving average before their signals can be effectively traded. For now, suffice it to say that negative divergence suggests a waning of momentum to the upside and that some degree of correction -- from the merely sideways to the brutally sharp -- should be expected. |

|
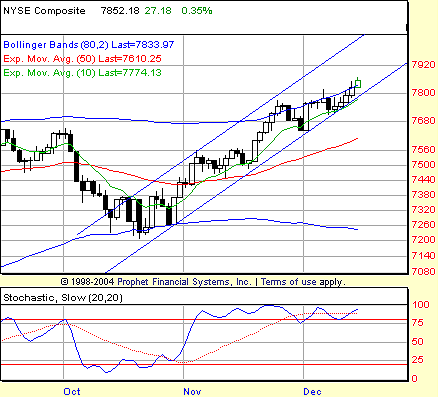
| FIGURE 2: NYSE, DAILY. A stochastic breakout (see my Working-Money.com article “BOSO” from October 5, 2005) in November set the stage for the NYSE’s November rally. Another stochastic breakout in late November looks to have propelled the NYSE higher in December. |
| Graphic provided by: Prophet Financial, Inc. |
| |
| Following the entry methodology I've often written about, there would have been no short accompanying the November/December negative stochastic divergence shown in Figure 1. The key or "point" day was December 7, the day that the second, lower (and divergent) peak in the stochastic turned down. Yet there was no follow-through to the downside after this day (my methodology would have required a print of 7675.45 or lower) and thus no short entry. On the other hand, there were clear buy entries in December as the NYSE Composite moved into and through early December. I'll provide examples of two instances. First, there was a MACD histogram reversal back to the upside as recently as December 12. Cutting the range of this day in half and adding that amount to the high of the day provided a buy entry at 7830.49. A long trade placed according to this methodology would be profitable as of this writing. The other instance in which a speculator or trader might have taken advantage of bullishness in the NYSE comes from the stochastic breakout. Here, the most recent stochastic breakout was on December 12, as the stochastic moved back into "overbought" territory after a brief, one-day foray outside that range. The stochastic breakout was confirmed on December 13 with a close above the high of December 12 (Figure 2). Such an entry, at approximately 7825, would also be profitable as of this writing. |
| What is most interesting about the NYSE Composite at this juncture is its relationship to its trend channel. While it is true that hugging the lower boundary of a trend channel suggests strongly that the lower boundary is providing a significant amount of support, it is also true that sooner or later, a market that is pinned to the lower boundary of a trend channel will eventually either have to move directly and dramatically higher, thus increasing the angle of ascent, or plow right into the side of the channel's lower boundary. The abundance of buy signals (both my "histochastic" and BOSO-related methods are on daily buy signals with regard to the NYSE Composite) suggests a steeper angle of ascent as the next move in the $NYA. But traders are advised to be wary in the event that the NYSE Composite cannot rise high enough or fast enough to avoid a collision with what was once sound technical support. |
Technical Writer for Technical Analysis of STOCKS & COMMODITIES magazine, Working-Money.com, and Traders.com Advantage.
| Title: | Technical Writer |
| Company: | Technical Analysis, Inc. |
| Address: | 4757 California Avenue SW |
| Seattle, WA 98116 | |
| Phone # for sales: | 206 938 0570 |
| Fax: | 206 938 1307 |
| Website: | www.Traders.com |
| E-mail address: | DPenn@traders.com |
Traders' Resource Links | |
| Charting the Stock Market: The Wyckoff Method -- Books | |
| Working-Money.com -- Online Trading Services | |
| Traders.com Advantage -- Online Trading Services | |
| Technical Analysis of Stocks & Commodities -- Publications and Newsletters | |
| Working Money, at Working-Money.com -- Publications and Newsletters | |
| Traders.com Advantage -- Publications and Newsletters | |
| Professional Traders Starter Kit -- Software | |
Click here for more information about our publications!
Comments
Date: 12/15/05Rank: 3Comment:

Request Information From Our Sponsors
- StockCharts.com, Inc.
- Candle Patterns
- Candlestick Charting Explained
- Intermarket Technical Analysis
- John Murphy on Chart Analysis
- John Murphy's Chart Pattern Recognition
- John Murphy's Market Message
- MurphyExplainsMarketAnalysis-Intermarket Analysis
- MurphyExplainsMarketAnalysis-Visual Analysis
- StockCharts.com
- Technical Analysis of the Financial Markets
- The Visual Investor
- VectorVest, Inc.
- Executive Premier Workshop
- One-Day Options Course
- OptionsPro
- Retirement Income Workshop
- Sure-Fire Trading Systems (VectorVest, Inc.)
- Trading as a Business Workshop
- VectorVest 7 EOD
- VectorVest 7 RealTime/IntraDay
- VectorVest AutoTester
- VectorVest Educational Services
- VectorVest OnLine
- VectorVest Options Analyzer
- VectorVest ProGraphics v6.0
- VectorVest ProTrader 7
- VectorVest RealTime Derby Tool
- VectorVest Simulator
- VectorVest Variator
- VectorVest Watchdog
