HOT TOPICS LIST
- MACD
- Fibonacci
- RSI
- Gann
- ADXR
- Stochastics
- Volume
- Triangles
- Futures
- Cycles
- Volatility
- ZIGZAG
- MESA
- Retracement
- Aroon
INDICATORS LIST
LIST OF TOPICS
PRINT THIS ARTICLE
by Kanwaljit Singh Mauj
A head & shoulders pattern can be both a consolidation and a reversal. You'll see why.
Position: Buy
Kanwaljit Singh Mauj
He is a technical analyst based in Delhi, India, a post-graduate from the Indian Institute of Capital Markets (formerly the UTI Institute of Capital Markets), Mumbai. He follows the Indian markets as well the US markets very closely. He has been active in the capital markets for the past five years.
He is an associate with AGIP Securities, which specializes in money management, index futures, live chat for daytraders, and independent technical analysis consultancy. The company has a big media presence from the likes of CNBC, NDTV Profit, and ZEE Business.
PRINT THIS ARTICLE
HEAD & SHOULDERS
Whirlpool Breakout From The Reverse Head & Shoulders
12/20/05 02:45:42 PMby Kanwaljit Singh Mauj
A head & shoulders pattern can be both a consolidation and a reversal. You'll see why.
Position: Buy
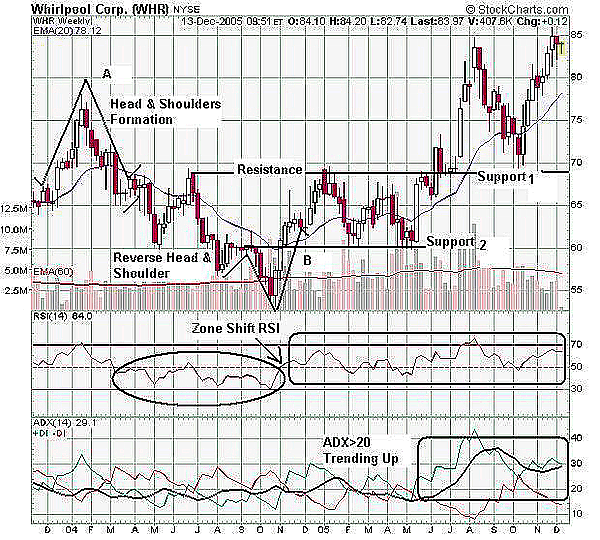
| Whirlpool Corp. (WHR) is showing a positive trend after the reverse head & shoulders formation on the weekly chart (Figure 1) as well as the daily chart (Figure 2). The head & shoulders formation, as the name suggests, generally has two shoulders and a head in between. It either shows accumulation or distribution. When the price closes below the neckline in a head & shoulders pattern, it indicates a selloff. The reverse is true for the reverse head & shoulders. |

|
| FIGURE 1: WHIRLPOOL, WEEKLY. Here, WHR has a head & shoulders formation and a reverse. Breakout from the resistance level is a strong buy signal. |
| Graphic provided by: StockCharts.com. |
| |
| In the weekly chart of Whirlpool (Figure 1), you can see a formation of head & shoulders (A) and a reverse head & shoulders (B). Joining the two shoulders is a neckline. This neckline becomes a support level for the stock, which when broken may result in a selloff. It also becomes a strong resistance on a reversal. The breakout from the resistance level is a strong buy signal, as seen on the chart formation. Figure 1 has been trending up since 2003. The reverse head & shoulders formation is a temporary breather for the stock, one that appears to have ended in November 2004. This is a good base for a stock to give a decent move to the upside. The $60 level that has worked as a support in head & shoulders will work as resistance now. Breakout from that level gives a fresh buy signal. The relative strength index (RSI) has also confirmed a zone shift in the RSI. The idea is to look for entry levels where you are comfortable buying the stock. You can do this by looking at the daily chart (Figure 2). |

|
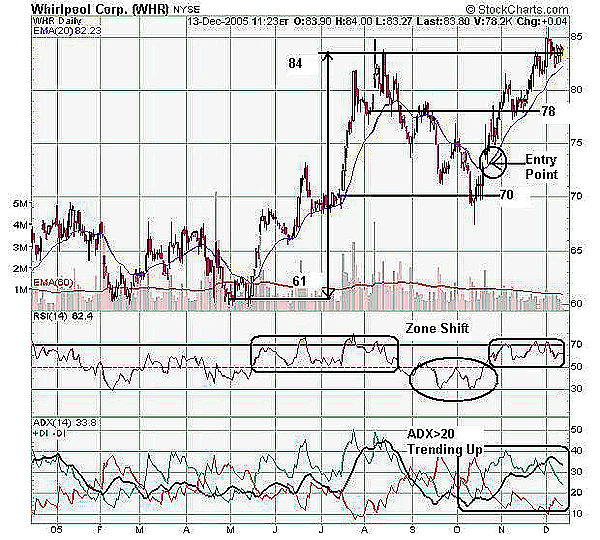
| FIGURE 2, WHIRLPOOL, DAILY. This daily chart suggests some good low-risk entry points by following the trend. |
| Graphic provided by: StockCharts.com. |
| |
| Figure 2, the daily chart, suggests some good low-risk entry points. You should follow the trend to look for possible safe entries. The important thing to consider here is the volume, which should also support your decision. The volume should also improve significantly as the stock comes out of consolidation. One of the best possible entries on this chart is the fresh breakout shown in the middle of October 2005. The stock has reversed from the $70 level, which has become a strong support now. The entry is only to be made after it crosses the 20-day exponential moving average (EMA) (blue line) levels -- that is, about the 72 level. The fresh breakout is also being supported by the relative strength index (RSI), which is where the zone shift takes place -- above 50 and also the average directional movement index (ADX), which is trending up (as in greater than 20). The target for this stock from the daily chart (Figure 2) is determined by measuring the move preceding the consolidation pattern and adding it onto the top of the pattern. The immediate target for this stock is $93-$94, which is ascertained by measuring the distance of the swing in dollar terms -- 84-61=$23, extending the difference from a fresh upmove. That level on this chart is the support level of $70; adding $23 to it gives us $93, which is the target for this stock. |
He is a technical analyst based in Delhi, India, a post-graduate from the Indian Institute of Capital Markets (formerly the UTI Institute of Capital Markets), Mumbai. He follows the Indian markets as well the US markets very closely. He has been active in the capital markets for the past five years.
He is an associate with AGIP Securities, which specializes in money management, index futures, live chat for daytraders, and independent technical analysis consultancy. The company has a big media presence from the likes of CNBC, NDTV Profit, and ZEE Business.
| Title: | Associate |
| Company: | AGIP Securities |
| Address: | C-735A, Sushant Lok-I |
| Gurgaon, Har | |
| Phone # for sales: | 98184-72389 |
| Website: | www.ashwanigujral.com |
| E-mail address: | contact@ashwanigujral.com |
Traders' Resource Links | |
| AGIP Securities has not added any product or service information to TRADERS' RESOURCE. | |
Click here for more information about our publications!
Comments
Date: 12/22/05Rank: 4Comment:

Request Information From Our Sponsors
- VectorVest, Inc.
- Executive Premier Workshop
- One-Day Options Course
- OptionsPro
- Retirement Income Workshop
- Sure-Fire Trading Systems (VectorVest, Inc.)
- Trading as a Business Workshop
- VectorVest 7 EOD
- VectorVest 7 RealTime/IntraDay
- VectorVest AutoTester
- VectorVest Educational Services
- VectorVest OnLine
- VectorVest Options Analyzer
- VectorVest ProGraphics v6.0
- VectorVest ProTrader 7
- VectorVest RealTime Derby Tool
- VectorVest Simulator
- VectorVest Variator
- VectorVest Watchdog
- StockCharts.com, Inc.
- Candle Patterns
- Candlestick Charting Explained
- Intermarket Technical Analysis
- John Murphy on Chart Analysis
- John Murphy's Chart Pattern Recognition
- John Murphy's Market Message
- MurphyExplainsMarketAnalysis-Intermarket Analysis
- MurphyExplainsMarketAnalysis-Visual Analysis
- StockCharts.com
- Technical Analysis of the Financial Markets
- The Visual Investor
