HOT TOPICS LIST
- MACD
- Fibonacci
- RSI
- Gann
- ADXR
- Stochastics
- Volume
- Triangles
- Futures
- Cycles
- Volatility
- ZIGZAG
- MESA
- Retracement
- Aroon
INDICATORS LIST
LIST OF TOPICS
PRINT THIS ARTICLE
by David Penn
There are gaps and there are breakouts. But a breakaway gap can be something to be bullish about.
Position: N/A
David Penn
Technical Writer for Technical Analysis of STOCKS & COMMODITIES magazine, Working-Money.com, and Traders.com Advantage.
PRINT THIS ARTICLE
BREAKAWAY GAP
TGEN's Bullish Breakaway Gap
08/11/00 02:31:33 PMby David Penn
There are gaps and there are breakouts. But a breakaway gap can be something to be bullish about.
Position: N/A
| Targeted Genetics (TGEN) is a Seattle biotechnology company that specializes in vectors. Vectors are neutralized viruses that are used to deliver gene-based drugs into problem cells, and represent part of the growing array of biological tools used in genetic medicine. The company does not have any drugs approved for sale as of yet, and has been operating at a loss. Still, their recently announced plan to acquire biotech rival Genovo, whose technology is expected to enhance Targeted Genetics' vector delivering capacity, seems to have excited investors, who bid TGEN up out of a downward July trend. |
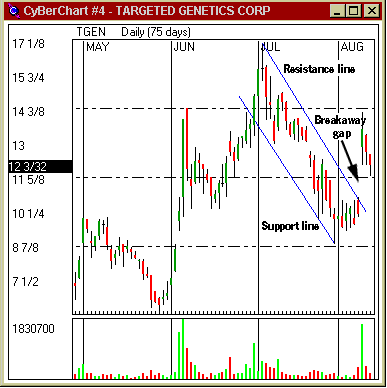
| After enjoying advances during the month of June, TGEN spent July declining through a fairly well-defined trend channel, repeatedly bumping against both its lines of resistance and support. Recall that such contact tends to underscore the validity of the channel, helping define regions above which and below which the price has refused to move and trade consistently. However, TGEN began to strain against its resistance line in August, as the chart below reveals. While the first initial moves above its line of resistance were not conclusive, a breakaway gap that developed on August 9th was the first real signal that TGEN's July downturn might be reversed. |

|
| Figure 1: TGEN's price chart showing a fairly well-defined trend channel. Note the volume surge of 1.6M on the breakaway gap. This is more than five times the average volume. |
| Graphic provided by: CyBerChart. |
| |
| Gaps appear on charts all the time. And while they are generally indicative of extremes in trading behavior (either exceptional interest in a stock or exceptional loathing), they can be very difficult to interpret. Gaps appear when the lowest price in a trading period (day, week, month, etc., depending on the chart) is above the highest price of the previous trading period. Conversely, gaps also occur when the highest price of a trading period is below the lowest price of the previous trading period. While there is a market axiom that suggests that all gaps are filled, that truism is probably more accurately rendered "most gaps are filled sooner or later." This is especially true in the case of breakaway gaps, which are often not filled--at least, not in the short-term. In fact, once the trend anticipated by the breakaway gap develops, often it will take a reversal for the breakaway gap to be filled. |
| Breakaway gaps are created when the price gap moves out of a price pattern. As the chart above suggests, the August 9th breakaway gap confirmed TGEN's upside movement out of the downward July trend channel. Upside breakaway gaps, such as this, need to be further confirmed by high volumes before they can be considered to represent real breakouts from a current trend. TGEN's August 9th volume establishes this clearly; a volume surge of 1.6 million shares that day was more than five times the average trading volume for TGEN. Not since June 6th, when TGEN closed at 14, has the stock seen such heavy volumes. |
| Trading on this breakaway gap alone would be exceptionally speculative. All the same, watching to see how TGEN's price reacts in the days following the gap could prove instructive. In particular, watching to see if TGEN exceeds its July high of 17 would be a strong indicator that the July trend is over and a renewed upswing is in place. If such were proven to be the case, July's downturn could be seen rightly as a simple corrective move off of TGEN's June advance. |
Technical Writer for Technical Analysis of STOCKS & COMMODITIES magazine, Working-Money.com, and Traders.com Advantage.
| Title: | Technical Writer |
| Company: | Technical Analysis, Inc. |
| Address: | 4757 California Avenue SW |
| Seattle, WA 98116 | |
| Phone # for sales: | 206 938 0570 |
| Fax: | 206 938 1307 |
| Website: | www.Traders.com |
| E-mail address: | DPenn@traders.com |
Traders' Resource Links | |
| Charting the Stock Market: The Wyckoff Method -- Books | |
| Working-Money.com -- Online Trading Services | |
| Traders.com Advantage -- Online Trading Services | |
| Technical Analysis of Stocks & Commodities -- Publications and Newsletters | |
| Working Money, at Working-Money.com -- Publications and Newsletters | |
| Traders.com Advantage -- Publications and Newsletters | |
| Professional Traders Starter Kit -- Software | |
Click here for more information about our publications!
Comments
Date: / /Rank: 5Comment:

|

Request Information From Our Sponsors
- StockCharts.com, Inc.
- Candle Patterns
- Candlestick Charting Explained
- Intermarket Technical Analysis
- John Murphy on Chart Analysis
- John Murphy's Chart Pattern Recognition
- John Murphy's Market Message
- MurphyExplainsMarketAnalysis-Intermarket Analysis
- MurphyExplainsMarketAnalysis-Visual Analysis
- StockCharts.com
- Technical Analysis of the Financial Markets
- The Visual Investor
- VectorVest, Inc.
- Executive Premier Workshop
- One-Day Options Course
- OptionsPro
- Retirement Income Workshop
- Sure-Fire Trading Systems (VectorVest, Inc.)
- Trading as a Business Workshop
- VectorVest 7 EOD
- VectorVest 7 RealTime/IntraDay
- VectorVest AutoTester
- VectorVest Educational Services
- VectorVest OnLine
- VectorVest Options Analyzer
- VectorVest ProGraphics v6.0
- VectorVest ProTrader 7
- VectorVest RealTime Derby Tool
- VectorVest Simulator
- VectorVest Variator
- VectorVest Watchdog
