HOT TOPICS LIST
- MACD
- Fibonacci
- RSI
- Gann
- ADXR
- Stochastics
- Volume
- Triangles
- Futures
- Cycles
- Volatility
- ZIGZAG
- MESA
- Retracement
- Aroon
INDICATORS LIST
LIST OF TOPICS
PRINT THIS ARTICLE
by Kanwaljit Singh Mauj
Boeing has been in a strong uptrend for many months. The ascending triangle on the daily charts gives us the target of $74.
Position: N/A
Kanwaljit Singh Mauj
He is a technical analyst based in Delhi, India, a post-graduate from the Indian Institute of Capital Markets (formerly the UTI Institute of Capital Markets), Mumbai. He follows the Indian markets as well the US markets very closely. He has been active in the capital markets for the past five years.
He is an associate with AGIP Securities, which specializes in money management, index futures, live chat for daytraders, and independent technical analysis consultancy. The company has a big media presence from the likes of CNBC, NDTV Profit, and ZEE Business.
PRINT THIS ARTICLE
ASCENDING TRIANGLES
Boeing On A Long-Term Trend
12/14/05 08:32:48 AMby Kanwaljit Singh Mauj
Boeing has been in a strong uptrend for many months. The ascending triangle on the daily charts gives us the target of $74.
Position: N/A
| Often, trends are measured and identified by trendlines. Rising trends are defined by a trendline that is drawn between two or more troughs to identify price support. Falling trends are defined by trendlines that are drawn between two or more peaks to identify price resistance. The principle of technical analysis is that once a trend has been formed, it will remain intact until broken. The idea is to use the current trend until the trendline is broken. |

|
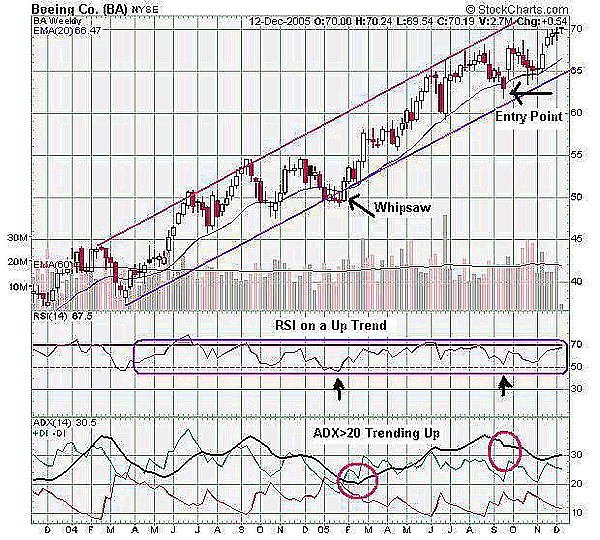
| FIGURE 1: BOEING, WEEKLY. In this chart, BA is continuously trending upward with a couple of whipsaws. |
| Graphic provided by: StockCharts.com. |
| |
| Figure 1, a weekly chart of Boeing (BA), is continuously trending upward with a couple of whipsaws. The idea is to look for an appropriate entry and join the bandwagon till the time the trendline is breached. The relative strength index (RSI) is depicting a bull phase staying above the 50 levels. The average directional movement index (ADX) is also again trending and staying above the 20 levels. The ADX and RSI both are showing bullish patterns on weekly as well as daily charts. The charts do show a couple of good entry points, but in the past. |

|
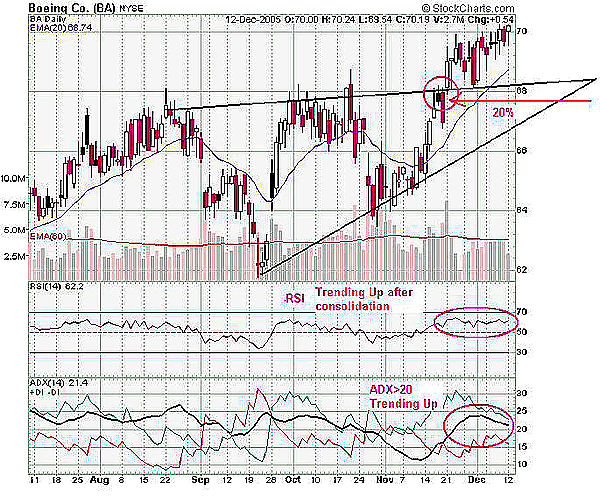
| FIGURE 2: BOEING, DAILY. In this chart of BA, a good entry point is suggested with an ascending triangle formation. |
| Graphic provided by: StockCharts.com. |
| |
| Figure 2, a daily chart of BA, does suggest a good entry point with an ascending triangle formation. In an ascending triangle, the upper trendline is drawn by joining two or more tops, and the lower trendline is drawn by joining two or more bottoms. The upper trendline normally is tilted slightly toward the top, and the lower trendline is also slanting upward, as is the formation in this case. On extending the trendlines, another important observation that can be seen is the breakout, around 20% before the point where the trendlines meet. Target for this stock is $74, which is based on measuring the move preceding the consolidation pattern and adding it to the breakout. The swing (if you look at Figure 2) started from approximately $62 and ended at $68 before taking a breather. The difference ($68-$62=$6), added to the breakout at $68, results in a price target of $74. |
| Typically, volume tends to shrink while the formation of the triangle is under way. It explodes when the price breaks out of the triangle and consolidates after the breakout. |
He is a technical analyst based in Delhi, India, a post-graduate from the Indian Institute of Capital Markets (formerly the UTI Institute of Capital Markets), Mumbai. He follows the Indian markets as well the US markets very closely. He has been active in the capital markets for the past five years.
He is an associate with AGIP Securities, which specializes in money management, index futures, live chat for daytraders, and independent technical analysis consultancy. The company has a big media presence from the likes of CNBC, NDTV Profit, and ZEE Business.
| Title: | Associate |
| Company: | AGIP Securities |
| Address: | C-735A, Sushant Lok-I |
| Gurgaon, Har | |
| Phone # for sales: | 98184-72389 |
| Website: | www.ashwanigujral.com |
| E-mail address: | contact@ashwanigujral.com |
Traders' Resource Links | |
| AGIP Securities has not added any product or service information to TRADERS' RESOURCE. | |
Click here for more information about our publications!
Comments
Date: 12/14/05Rank: 4Comment:
Date: 12/21/05Rank: 5Comment:

Request Information From Our Sponsors
- StockCharts.com, Inc.
- Candle Patterns
- Candlestick Charting Explained
- Intermarket Technical Analysis
- John Murphy on Chart Analysis
- John Murphy's Chart Pattern Recognition
- John Murphy's Market Message
- MurphyExplainsMarketAnalysis-Intermarket Analysis
- MurphyExplainsMarketAnalysis-Visual Analysis
- StockCharts.com
- Technical Analysis of the Financial Markets
- The Visual Investor
- VectorVest, Inc.
- Executive Premier Workshop
- One-Day Options Course
- OptionsPro
- Retirement Income Workshop
- Sure-Fire Trading Systems (VectorVest, Inc.)
- Trading as a Business Workshop
- VectorVest 7 EOD
- VectorVest 7 RealTime/IntraDay
- VectorVest AutoTester
- VectorVest Educational Services
- VectorVest OnLine
- VectorVest Options Analyzer
- VectorVest ProGraphics v6.0
- VectorVest ProTrader 7
- VectorVest RealTime Derby Tool
- VectorVest Simulator
- VectorVest Variator
- VectorVest Watchdog
