HOT TOPICS LIST
- MACD
- Fibonacci
- RSI
- Gann
- ADXR
- Stochastics
- Volume
- Triangles
- Futures
- Cycles
- Volatility
- ZIGZAG
- MESA
- Retracement
- Aroon
INDICATORS LIST
LIST OF TOPICS
PRINT THIS ARTICLE
by Paolo Pezzutti
Jeff Cooper's Hit and Run methodology profits from a pause after an expansion breakout bar.
Position: N/A
Paolo Pezzutti
Author of the book "Trading the US Markets - A Comprehensive Guide to US Markets for International Traders and Investors" - Harriman House (July 2008)
PRINT THIS ARTICLE
BREAKOUTS
Short-Term Pattern: Jack In The Box
12/13/05 09:05:14 AMby Paolo Pezzutti
Jeff Cooper's Hit and Run methodology profits from a pause after an expansion breakout bar.
Position: N/A
| The concept behind the setup is that strongly trending stocks pull back before resuming their original trend. In this case, the stock will take a one-day rest before continuing on its way. This happens because traders who bought at lower prices with a short-term approach decide to lock in their profits. Momentum traders use the pullback to build their position at lower levels, once again causing prices to explode (the opposite is true for downtrending markets). It is impossible to predict how far the movement will go. I may, however, suggest locking in profits, at least partially, near the close of the entry day. Jeff Cooper's strategy thrives on a pause in a trending market in the form of an inside day that follows new highs or new lows. After the expansion, there is a contraction that could anticipate the original trend resumption. The rules suggested by Cooper in his famous book Hit And Run II are: - You have a new 60-day high on day 1 with the largest range of the previous nine trading sessions (expansion breakout bar). - On day 2, the stock prints an inside day with reference to the day 1 high. - Following the inside day (day 3), place a buy-stop one tick above the day 1 high. - If the stock closes strongly at the top of the day's range, Jeff Cooper suggests holding at least half of the position overnight, looking for a follow-through the next day. The intent is to lock in solid profits when they are available. Cooper suggests risking one point in this strategy, but I believe different risk implementations could be applied, depending on your trading style. Keep in mind that proper risk management is the key for the success of this strategy, as well as of any other short-term pattern. The opposite rules are true in a downtrending market. Let's see some examples: |

|
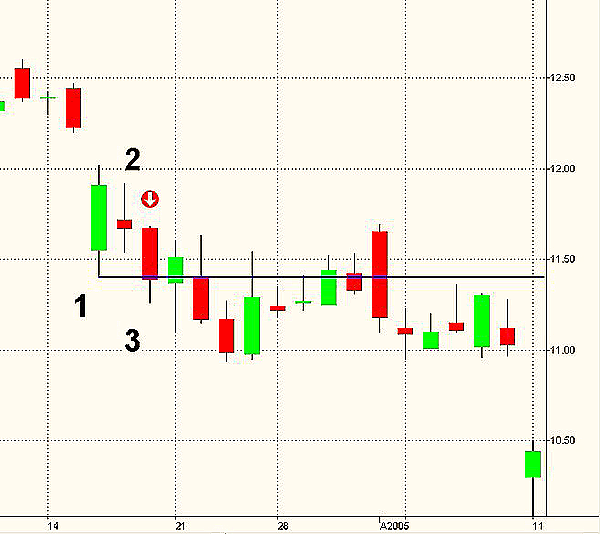
| FIGURE 1: FORD, DAILY. This daily chart prints a "Jack In The Box" setup to the downside. |
| Graphic provided by: TradeStation. |
| |
| In Figure 1, you can see a daily chart of Ford (F). The stock is in a downtrend and prints new lows on day 1. The next trading session, an inside day, activates the setup. On day 3, a sell-stop order is filled, although the close of the day is very close to the entry point. The next day, prices retrace slightly up before two down days are printed. The result of this trade depends on your exit rules. But you could say that since the beginning, the expected increase in volatility in the direction of the trend did not occur. I would look to close the trade as soon as possible. |

|
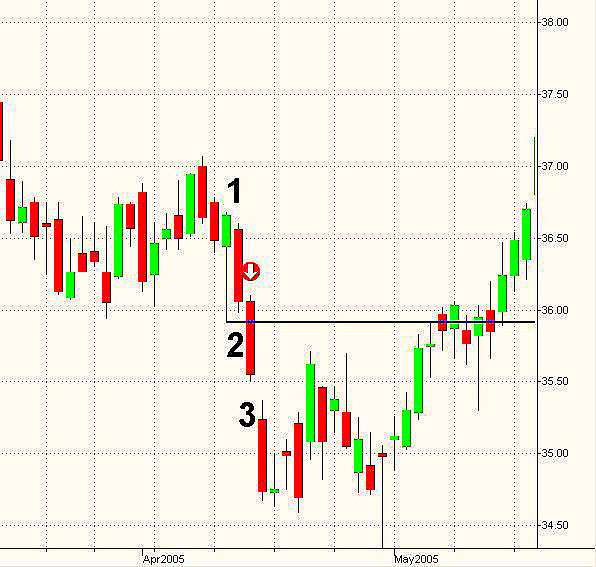
| FIGURE 2: QQQQ, DAILY. The QQQQ displays an excellent trade opportunity during the April 2005 downtrend. |
| Graphic provided by: TradeStation. |
| |
| In Figure 2, the daily chart of QQQQ prints an excellent setup in April 2005. The breakout of the day 1 low allows you to profit from a trend day to the downside. The movement is as explosive as expected, and the next day, prices gap lower and run on another trend day. On these expansions, you should lock in your profits. |

|
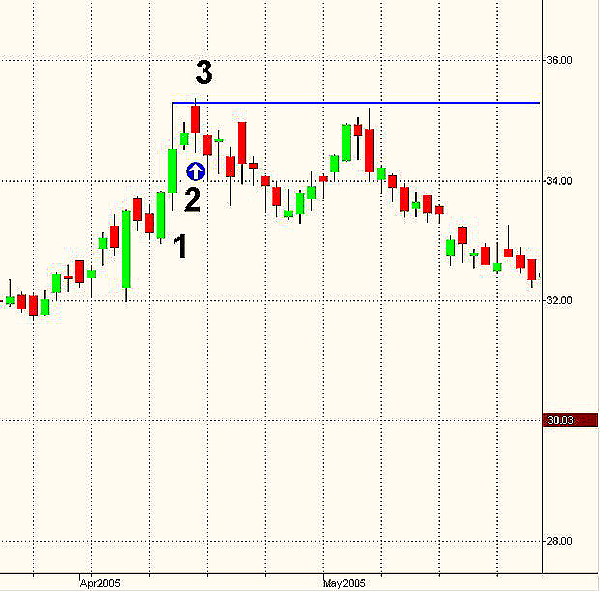
| FIGURE 3: MERCK, DAILY. The Merck daily chart prints a pattern failure in April 2005. |
| Graphic provided by: TradeStation. |
| |
| In Figure 3, Merck (MRK) prints new highs on day 1. Day 2 confirms the pattern setup. On day 3, your buy-stop order is filled. The close of the day, however, is negative and leaves you open to the overnight risk. Even if the stop-loss is not hit, I would consider the trade a failure and close the position at the close. The next day's prices continue to move lower. |
| As a summary, this pattern is not very common. You must scan your database looking for suitable trades, but there aren't that many. Even when you have a setup, prices may not move and fill your stop order the way you would like. However, the concept behind it is valid, and most times, you must expect rising volatility in the direction of the trend right after your entry. When applying strict risk control rules, you must expect small losses and some big gains that reward you for your patience. |
Author of the book "Trading the US Markets - A Comprehensive Guide to US Markets for International Traders and Investors" - Harriman House (July 2008)
| Address: | VIA ROBERTO AGO 26 POSTAL CODE 00166 |
| Rome, ITALY | |
| Phone # for sales: | +393357540708 |
| E-mail address: | pezzutti.paolo@tiscali.it |
Click here for more information about our publications!
Comments
Date: 12/13/05Rank: 3Comment:
Date: 12/28/05Rank: 4Comment:

|

Request Information From Our Sponsors
- StockCharts.com, Inc.
- Candle Patterns
- Candlestick Charting Explained
- Intermarket Technical Analysis
- John Murphy on Chart Analysis
- John Murphy's Chart Pattern Recognition
- John Murphy's Market Message
- MurphyExplainsMarketAnalysis-Intermarket Analysis
- MurphyExplainsMarketAnalysis-Visual Analysis
- StockCharts.com
- Technical Analysis of the Financial Markets
- The Visual Investor
- VectorVest, Inc.
- Executive Premier Workshop
- One-Day Options Course
- OptionsPro
- Retirement Income Workshop
- Sure-Fire Trading Systems (VectorVest, Inc.)
- Trading as a Business Workshop
- VectorVest 7 EOD
- VectorVest 7 RealTime/IntraDay
- VectorVest AutoTester
- VectorVest Educational Services
- VectorVest OnLine
- VectorVest Options Analyzer
- VectorVest ProGraphics v6.0
- VectorVest ProTrader 7
- VectorVest RealTime Derby Tool
- VectorVest Simulator
- VectorVest Variator
- VectorVest Watchdog
