HOT TOPICS LIST
- MACD
- Fibonacci
- RSI
- Gann
- ADXR
- Stochastics
- Volume
- Triangles
- Futures
- Cycles
- Volatility
- ZIGZAG
- MESA
- Retracement
- Aroon
INDICATORS LIST
LIST OF TOPICS
PRINT THIS ARTICLE
by Koos van der Merwe
The Xbox -- a winner this Xmas for Microsoft?
Position: Hold
Koos van der Merwe
Has been a technical analyst since 1969, and has worked as a futures and options trader with First Financial Futures in Johannesburg, South Africa.
PRINT THIS ARTICLE
TRIANGLES
Microsoft... Is It A Buy?
12/08/05 01:16:47 PMby Koos van der Merwe
The Xbox -- a winner this Xmas for Microsoft?
Position: Hold
| To compete in a very demanding market, Microsoft released its new Xbox to take advantage of Christmas sales without having enough stock on hand to fill all the orders received. Do we figure these unfulfilled orders into a future share price, or will sales be stolen by what is available to fill that Christmas stocking? |

|
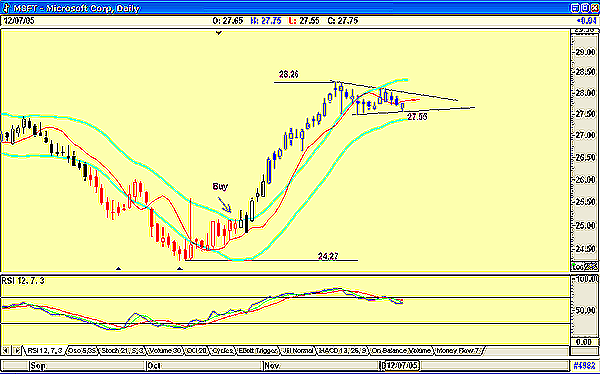
| FIGURE 1: MICROSOFT, DAILY. MSFT is showing a suggested upside target. |
| Graphic provided by: AdvancedGET. |
| |
| Figure 1 is a short-term daily chart of Microsoft (MSFT). It shows how MSFT has risen from a low of $24.27 on October 11 to a high of $28.26 by November 18. It appears to form a consolidation triangle at that point, which suggests an upside target of $31.54. However, the relative strength index (RSI) is suggesting weakness. Because of this, we should look at a weekly chart to get a better idea of what is going on. |

|
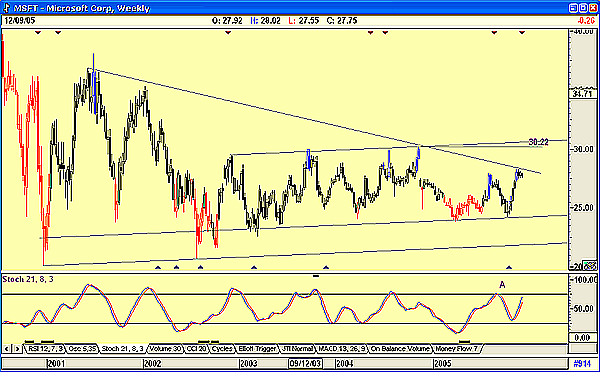
| FIGURE 2: MICROSOFT, WEEKLY. This MSFT weekly chart shows trend channels. |
| Graphic provided by: AdvancedGET. |
| |
| The weekly chart (Figure 2) shows how the share price is testing a long-term resistance line. The 21-10-3 stochastic, my preferred parameters for weekly charts, is also suggesting weakness. The chart also shows that should the price break through the resistance line, then it could rise to test the pivot point target of $30.22, close enough to the triangular target of the daily chart to suggest this target is feasible. The stochastic that gave a sell at "A" is not very convincing, but it could form a divergence sell, where the price makes a higher high ($30.22) and the stochastic a lower high. Note how the target of $30.22 is close to the upper resistance line drawn at a parallel to the support lines. So the question is: Would you buy Microsoft today? The charts are suggesting that there is still about $2 in the share, and traders could go for that, but investors should rather stay away, at least for the moment. |
Has been a technical analyst since 1969, and has worked as a futures and options trader with First Financial Futures in Johannesburg, South Africa.
| Address: | 3256 West 24th Ave |
| Vancouver, BC | |
| Phone # for sales: | 6042634214 |
| E-mail address: | petroosp@gmail.com |
Click here for more information about our publications!
Comments
Date: 12/08/05Rank: 3Comment:

Request Information From Our Sponsors
- StockCharts.com, Inc.
- Candle Patterns
- Candlestick Charting Explained
- Intermarket Technical Analysis
- John Murphy on Chart Analysis
- John Murphy's Chart Pattern Recognition
- John Murphy's Market Message
- MurphyExplainsMarketAnalysis-Intermarket Analysis
- MurphyExplainsMarketAnalysis-Visual Analysis
- StockCharts.com
- Technical Analysis of the Financial Markets
- The Visual Investor
- VectorVest, Inc.
- Executive Premier Workshop
- One-Day Options Course
- OptionsPro
- Retirement Income Workshop
- Sure-Fire Trading Systems (VectorVest, Inc.)
- Trading as a Business Workshop
- VectorVest 7 EOD
- VectorVest 7 RealTime/IntraDay
- VectorVest AutoTester
- VectorVest Educational Services
- VectorVest OnLine
- VectorVest Options Analyzer
- VectorVest ProGraphics v6.0
- VectorVest ProTrader 7
- VectorVest RealTime Derby Tool
- VectorVest Simulator
- VectorVest Variator
- VectorVest Watchdog
