HOT TOPICS LIST
- MACD
- Fibonacci
- RSI
- Gann
- ADXR
- Stochastics
- Volume
- Triangles
- Futures
- Cycles
- Volatility
- ZIGZAG
- MESA
- Retracement
- Aroon
INDICATORS LIST
LIST OF TOPICS
PRINT THIS ARTICLE
by David Penn
Although not confirmed by the stochastic, the MACD histogram's negative divergence still suggests softer prices in the near term for Google.
Position: N/A
David Penn
Technical Writer for Technical Analysis of STOCKS & COMMODITIES magazine, Working-Money.com, and Traders.com Advantage.
PRINT THIS ARTICLE
MACD
Meet Google's Histogram
12/08/05 11:14:36 AMby David Penn
Although not confirmed by the stochastic, the MACD histogram's negative divergence still suggests softer prices in the near term for Google.
Position: N/A
| Is one signal from one indicator enough for you? Or are you the type who prefers confirmation first? |
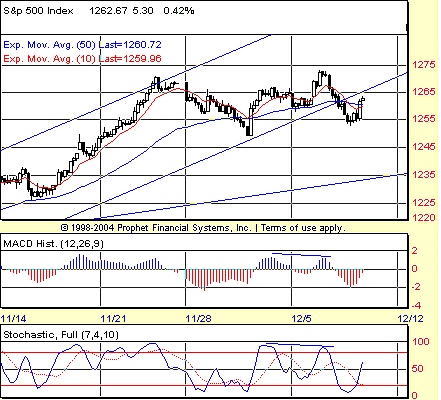
| I've preferred to take my positive and negative divergence signals from the stochastic rather than the MACDH (moving average convergence/divergence histogram), especially in the daily time frame. But increasingly, I have been looking for confirmation from the MACDH, especially when looking at the potential for deep corrections (or even tops and reversals). There was an excellent example of this sort of confirmed negative divergence signal in the hourly Standard & Poor's 500 back on December 6 (Figure 1). This pair of divergences anticipated the S&P 500's breakdown out of a trend channel that had contained the market's movement since the seasonal lows in October. |

|
| FIGURE 1: S&P 500, HOURLY. The negative divergence in the stochastic is confirmed by a negative divergence in the MACDH. A breakdown beneath a support trendline that had been intact since the October lows followed shortly thereafter. |
| Graphic provided by: Prophet Financial, Inc. |
| |
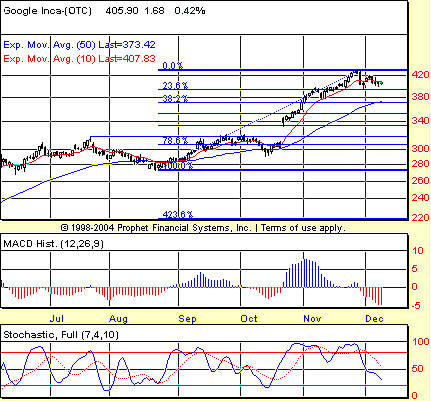
| About six weeks ago, I wrote about a breakout in Google ("Google With Handle," Traders.com Advantage, October 27, 2005). The minimum upside from that breakout was suggested to be $360, a level that was reached on October 31, a few days after that article was published. Since then, Google (GOOG) continued to rally higher, closing above $420 in late November. But the rally may have taken its toll on buyers -- especially those arriving late to the party. There were two advances out of the autumn cup-with-handle in Google: the first in late October and the second during November (Figure 2). As the MACDH shows, the first advance was very strong, creating the sort of MACDH peak that almost guarantees higher prices going forward. |

|
| FIGURE 2: GOOGLE, DAILY. Black Friday was just bullish enough to prevent the stochastic from creating a negative divergence that would have confirmed the negative divergence from the MACDH. Note also how the 50-day exponential moving average (EMA) (in blue) corresponds with a potential source of support at the Fibonacci 38.2% retracement level. |
| Graphic provided by: Prophet Financial, Inc. |
| |
| The second advance, however, produced a remarkably low MACDH peak, creating a negative divergence. This negative divergence is almost confirmed by the stochastic. In fact, save for some minor bullish behavior on Black Friday (the day after the Thanksgiving holiday), the stochastic would have likely created a negative divergence of its own -- thus confirming the MACDH's bearish portents. |
| The combination of the MACDH negative divergence and the faux negative divergence in the stochastic certainly painted a picture of a market that is likely to be weaker rather than stronger in the near term. It is also worth pointing out that the early December MACDH is particularly deep relative to recent troughs. In fact, the MACDH trough here is deeper than any correction in GOOG ever created. This suggests strongly that the price lows recorded as this major trough was formed will be exceeded before Google's correction can be considered complete. |
Technical Writer for Technical Analysis of STOCKS & COMMODITIES magazine, Working-Money.com, and Traders.com Advantage.
| Title: | Technical Writer |
| Company: | Technical Analysis, Inc. |
| Address: | 4757 California Avenue SW |
| Seattle, WA 98116 | |
| Phone # for sales: | 206 938 0570 |
| Fax: | 206 938 1307 |
| Website: | www.Traders.com |
| E-mail address: | DPenn@traders.com |
Traders' Resource Links | |
| Charting the Stock Market: The Wyckoff Method -- Books | |
| Working-Money.com -- Online Trading Services | |
| Traders.com Advantage -- Online Trading Services | |
| Technical Analysis of Stocks & Commodities -- Publications and Newsletters | |
| Working Money, at Working-Money.com -- Publications and Newsletters | |
| Traders.com Advantage -- Publications and Newsletters | |
| Professional Traders Starter Kit -- Software | |
Click here for more information about our publications!
Comments
Date: 12/08/05Rank: 3Comment:
Date: 12/21/05Rank: 4Comment:

Request Information From Our Sponsors
- StockCharts.com, Inc.
- Candle Patterns
- Candlestick Charting Explained
- Intermarket Technical Analysis
- John Murphy on Chart Analysis
- John Murphy's Chart Pattern Recognition
- John Murphy's Market Message
- MurphyExplainsMarketAnalysis-Intermarket Analysis
- MurphyExplainsMarketAnalysis-Visual Analysis
- StockCharts.com
- Technical Analysis of the Financial Markets
- The Visual Investor
- VectorVest, Inc.
- Executive Premier Workshop
- One-Day Options Course
- OptionsPro
- Retirement Income Workshop
- Sure-Fire Trading Systems (VectorVest, Inc.)
- Trading as a Business Workshop
- VectorVest 7 EOD
- VectorVest 7 RealTime/IntraDay
- VectorVest AutoTester
- VectorVest Educational Services
- VectorVest OnLine
- VectorVest Options Analyzer
- VectorVest ProGraphics v6.0
- VectorVest ProTrader 7
- VectorVest RealTime Derby Tool
- VectorVest Simulator
- VectorVest Variator
- VectorVest Watchdog
