HOT TOPICS LIST
- MACD
- Fibonacci
- RSI
- Gann
- ADXR
- Stochastics
- Volume
- Triangles
- Futures
- Cycles
- Volatility
- ZIGZAG
- MESA
- Retracement
- Aroon
INDICATORS LIST
LIST OF TOPICS
PRINT THIS ARTICLE
by David Penn
Positive divergences in both the MACD histogram and the stochastic suggest that lower energy prices are still at least a rally away.
Position: N/A
David Penn
Technical Writer for Technical Analysis of STOCKS & COMMODITIES magazine, Working-Money.com, and Traders.com Advantage.
PRINT THIS ARTICLE
REVERSAL
Oil And Gas Bound Higher
12/05/05 10:55:47 AMby David Penn
Positive divergences in both the MACD histogram and the stochastic suggest that lower energy prices are still at least a rally away.
Position: N/A
| How long does it take for people to become accustomed to a given circumstance? For months, investors convinced themselves that energy prices could only head higher. Then the conventional wisdom seemed to shift, and more and more people began to take the contrarian stance that energy prices -- like the ever-looming bird flu pandemic -- might have a bark that is far worse than their bite. |
| A typical view was expressed in a news piece at TheStreet.com, in which a knowledgeable observer suggested the "potential for lower prices in the very near term," citing issues of storage and production. Unless the weather got very cold, very soon, this observer said, the fears of sky-high fuel prices this winter just might not materialize. |

|
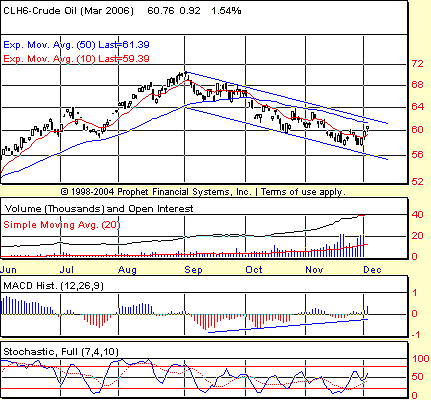
| FIGURE 1: CRUDE OIL FUTURES, MARCH, DAILY. The decline in crude oil has followed an orderly pattern through a three-month downtrend channel. Note the higher troughs in the MACD histogram (in red), which suggest waning strength on the part of the sellers with each low. |
| Graphic provided by: Prophet Financial, Inc. |
| |
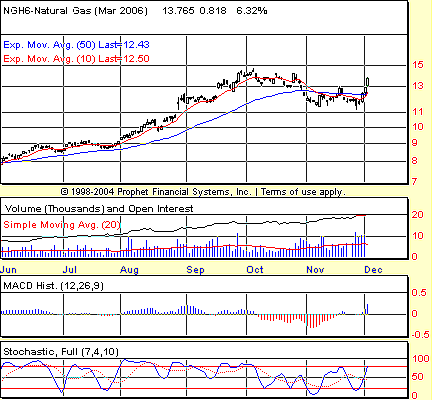
| If conventional wisdom has turned back against the notion of higher energy prices, then is it time for contrarians to once again switch positions, finding themselves back at the beginning of the big energy controversy where higher prices were seen as inevitable? Right now, the technicals back just such a flip-flop, as crude oil futures and natural gas futures show signs of having established significant intermediate-term bottoms in November -- just in time for the shivering season. See Figures 1 and 2. |

|
| FIGURE 2: NATURAL GAS, MARCH, DAILY. Positive divergences in both the stochastic and the MACD histogram suggest that an intermediate-term low was established in late November -- and that higher natural gas prices are likely in the near term. |
| Graphic provided by: Prophet Financial, Inc. |
| |
| In the case of crude oil, that market has been in decline since topping out in late August (basis March 2006). And a potential intermediate-term low in late November would make for a three-month decline that saw crude oil futures slip from just above 70 to just below 58. The decline has been well contained by a parallel trend channel as well as the 50-day exponential moving average (EMA) (at least over the October-November period for the latter). Interestingly -- switching for a moment to continuous crude oil futures -- as measured from the May 2005 low, crude oil's decline has retraced 61.8% of the advance. As measured from the December 2004 low, crude oil's decline has retraced 50% of the advance. And believe it or not, as measured from the June 2004 low, crude oil's decline has retraced just a few points more than 38.2% of the advance. All of this is part of a context that includes a positive divergence in the moving average convergence/divergence (MACD) histogram, as higher and higher troughs in the indicator are matched against lower and lower troughs in price. Similar positive divergences appear in the stochastic, suggesting that a significant low was increasingly likely as prices moved lower. |

|
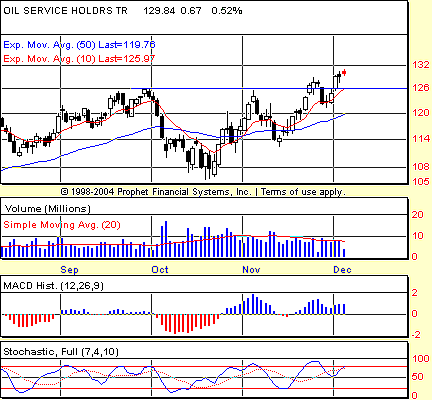
| FIGURE 3: OIL SERVICE HOLDRS, DAILY. New highs in the OIH in late November and again in early December suggest higher prices for crude oil in the near term. |
| Graphic provided by: Prophet Financial, Inc. |
| |
| Perhaps a final piece to this puzzle is the behavior of oil stocks. As we recall from intermarket analysis, when commodity stocks rise before the actual commodity does, it often signals that the commodity will reverse and begin to rise as well. It could be said that commodity stocks are a leading indicator of commodity prices in many ways. As it stands, oil stocks -- which investors and speculators had been running from in October -- have been wedging higher ever since the October lows and, as measured by the oil service HOLDRS, have recently bested their September highs. See Figure 3. Combine that with the fact that I'm starting to get cold calls from brokers pushing options on heating oil, and you have to wonder if there might be one more huzzah! for the higher energy price crowd before this bull market in commodities like petroleum and natural gas will have run its course. |
Technical Writer for Technical Analysis of STOCKS & COMMODITIES magazine, Working-Money.com, and Traders.com Advantage.
| Title: | Technical Writer |
| Company: | Technical Analysis, Inc. |
| Address: | 4757 California Avenue SW |
| Seattle, WA 98116 | |
| Phone # for sales: | 206 938 0570 |
| Fax: | 206 938 1307 |
| Website: | www.Traders.com |
| E-mail address: | DPenn@traders.com |
Traders' Resource Links | |
| Charting the Stock Market: The Wyckoff Method -- Books | |
| Working-Money.com -- Online Trading Services | |
| Traders.com Advantage -- Online Trading Services | |
| Technical Analysis of Stocks & Commodities -- Publications and Newsletters | |
| Working Money, at Working-Money.com -- Publications and Newsletters | |
| Traders.com Advantage -- Publications and Newsletters | |
| Professional Traders Starter Kit -- Software | |
Click here for more information about our publications!
Comments
Date: 12/05/05Rank: 3Comment:
Date: 12/06/05Rank: 5Comment:
Date: 12/07/05Rank: 5Comment:
Date: 12/07/05Rank: Comment: As a brand new online investor with little knowledge, where should I start if I have $5000.00 of disposable income to invest.

Request Information From Our Sponsors
- StockCharts.com, Inc.
- Candle Patterns
- Candlestick Charting Explained
- Intermarket Technical Analysis
- John Murphy on Chart Analysis
- John Murphy's Chart Pattern Recognition
- John Murphy's Market Message
- MurphyExplainsMarketAnalysis-Intermarket Analysis
- MurphyExplainsMarketAnalysis-Visual Analysis
- StockCharts.com
- Technical Analysis of the Financial Markets
- The Visual Investor
- VectorVest, Inc.
- Executive Premier Workshop
- One-Day Options Course
- OptionsPro
- Retirement Income Workshop
- Sure-Fire Trading Systems (VectorVest, Inc.)
- Trading as a Business Workshop
- VectorVest 7 EOD
- VectorVest 7 RealTime/IntraDay
- VectorVest AutoTester
- VectorVest Educational Services
- VectorVest OnLine
- VectorVest Options Analyzer
- VectorVest ProGraphics v6.0
- VectorVest ProTrader 7
- VectorVest RealTime Derby Tool
- VectorVest Simulator
- VectorVest Variator
- VectorVest Watchdog
