HOT TOPICS LIST
- MACD
- Fibonacci
- RSI
- Gann
- ADXR
- Stochastics
- Volume
- Triangles
- Futures
- Cycles
- Volatility
- ZIGZAG
- MESA
- Retracement
- Aroon
INDICATORS LIST
LIST OF TOPICS
PRINT THIS ARTICLE
by Paolo Pezzutti
General Motors is close to its all-time lows and is developing a short-term reversal setup.
Position: N/A
Paolo Pezzutti
Author of the book "Trading the US Markets - A Comprehensive Guide to US Markets for International Traders and Investors" - Harriman House (July 2008)
PRINT THIS ARTICLE
CHART ANALYSIS
GM: A Short-Term Adam And Eve Setup
12/05/05 08:23:10 AMby Paolo Pezzutti
General Motors is close to its all-time lows and is developing a short-term reversal setup.
Position: N/A
| November sales confirmed the difficult conditions of the automobile industry in the US. When assessing future prospects, analysts are divided. Some say the worst has passed, while others believe that further weakness is ahead. Currently, markets are negative on General Motors (GM), the price of which last month hit its lowest numbers in decades. There is pessimism all around the automaker giant. |

|
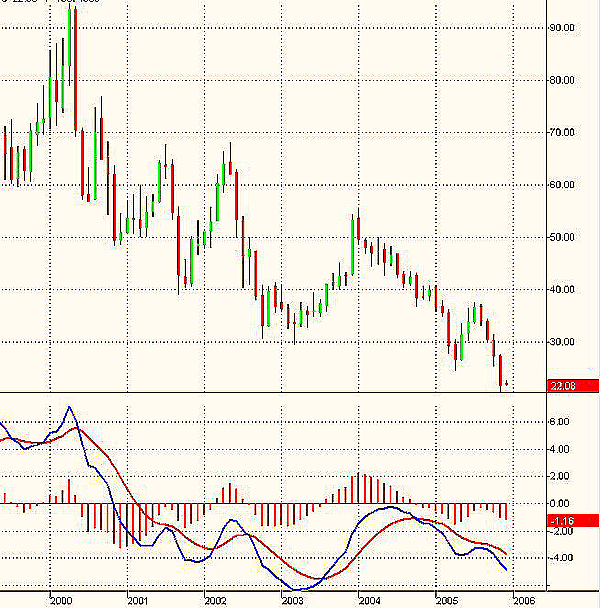
| FIGURE 1: GENERAL MOTORS, MONTHLY. This GM chart displays the last five-year downtrend. |
| Graphic provided by: TradeStation. |
| |
| In Figure 1, you can see the monthly chart of GM. The decline from the 2000 top is impressive, falling all the way from a high of about $94 to the present $22. I used the moving average convergence/divergence (MACD) to assess the technical situation in this time frame. The indicator calculates two exponential moving averages (EMAs); the difference between these two averages is plotted as the MACD (blue line). This value is averaged and then plotted as the MACDAvg (red line). The difference between MACD and MACD average is plotted as the MACDDiff (red histogram). The MACD is printing a positive divergence with respect to the 2003 low. In addition, the MACDiff is printing a positive divergence compared to the April 2005 low. |

|
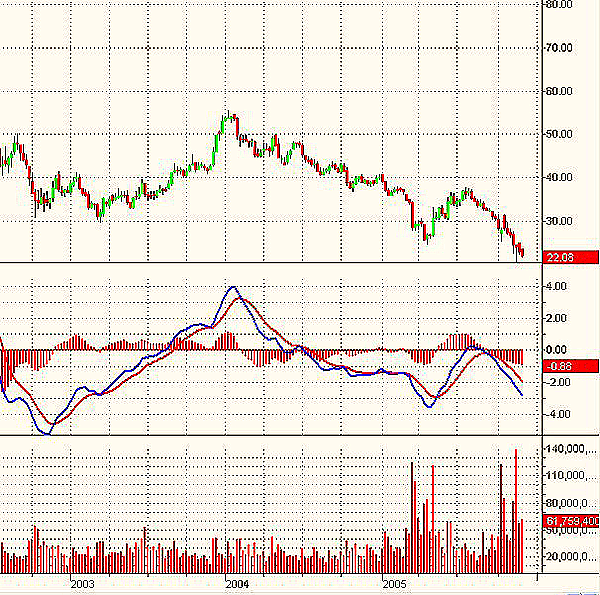
| FIGURE 2: GENERAL MOTORS, WEEKLY. This GM chart shows multiple positive divergences. |
| Graphic provided by: TradeStation. |
| |
| In Figure 2, the weekly chart, the MACD indicator confirms a positive divergence between the October 2002 low and the April 2005 low. In addition, there is another MACD positive divergence on the last November low; the indicator so far is not managing to reach new lows. The November 18th week low was printed with an all-time record volume of more 139 million shares. The bar after a deep low closed the week at its high and printed a hammer. The pattern can be recognized by the fact that the real body is at the upper end of the trading range, the long lower shadow is more than twice the height of the real body, and finally, it has a very short upper shadow. The bar indicates that bears are no longer in control. |

|
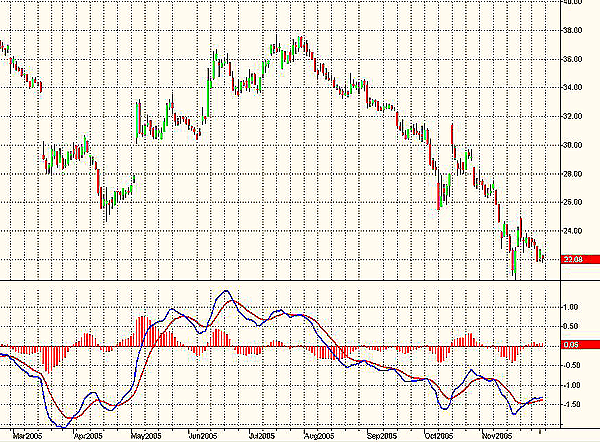
| FIGURE 3: GENERAL MOTORS, DAILY. This chart shows an MACD divergence between the November 17th low and the March low. |
| Graphic provided by: TradeStation. |
| |
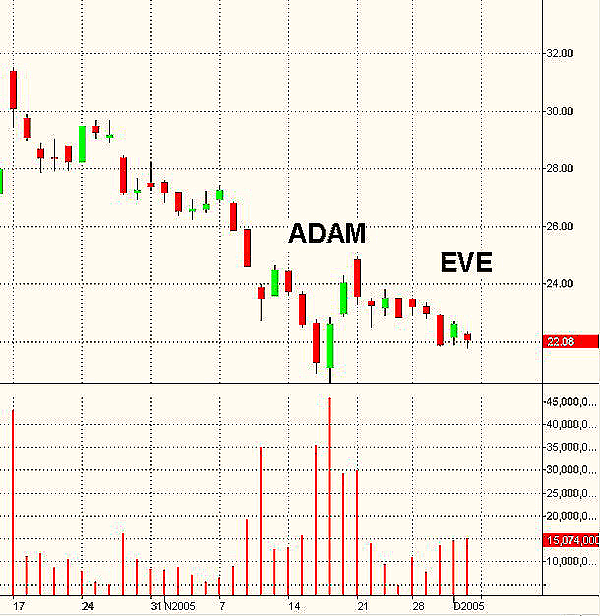
| The daily time frame (Figure 3) displays a MACD divergence between the November 17th low and the March low. In Figure 4, you can see that on November 16-17, GM printed a variation of a candlestick piercing pattern. The first day was a strong black real body. The next day's price opened below the prior session's real body (the classic pattern provides an open below the previous day's low). By the end of the session, the market closed near the high of the day and well within the prior day's black body. The rationale of the pattern is clear. A strong black candlestick is followed by a low on the next session's opening. Thus far, the bears are in control. But then no continuation of the movement occurs and bears are trapped. GM is now developing what could be an Adam and Eve formation. This formation is characterized by a sharp and deep first bottom on high volume (Adam). The stock bounces and develops a more gentle correction, printing a second bottom (Eve) on lower volatility. The Eve formation's rounded bottom takes longer to develop than the Adam spike and is characterized by lower volumes. Price action develops into a tight range and the stock then breaks to the upside. The top of Eve marks an excellent entry point when broken. The resistance is located along the top of the center retracement pivot. Sometimes they occur at the end of parabolic rallies. Note that GM behavior, so far, characterizes this formation. Before taking action, however, think twice: risk must be managed with discipline. Sometimes you might believe that a bottom has been reached, only to find out that prices are moving to new lows. The failure of this pattern will gain downside momentum quickly. Entry is not easy psychologically, because sentiment is negative. The potential for short-term profits is high, because the reversal, when successful, is explosive. |

|
| FIGURE 4: GM, POTENTIAL FORMATION. This chart shows a potential Adam and Eve formation developing. |
| Graphic provided by: TradeStation. |
| |
| In summary, the technical situation in the long and medium term is negative. MACD divergences, however, indicate that there could be, at least, a short-term reversal. The hammer on the weekly time frame on high volume indicates that the stock placed a fundamental support that, if broken, would bring further acceleration to the downtrend. The daily time frame is developing a short-term reversal formation -- the Adam and Eve -- that, if completed, could bring prices higher. |
Author of the book "Trading the US Markets - A Comprehensive Guide to US Markets for International Traders and Investors" - Harriman House (July 2008)
| Address: | VIA ROBERTO AGO 26 POSTAL CODE 00166 |
| Rome, ITALY | |
| Phone # for sales: | +393357540708 |
| E-mail address: | pezzutti.paolo@tiscali.it |
Click here for more information about our publications!
Comments
Date: 12/05/05Rank: 3Comment:

Request Information From Our Sponsors
- VectorVest, Inc.
- Executive Premier Workshop
- One-Day Options Course
- OptionsPro
- Retirement Income Workshop
- Sure-Fire Trading Systems (VectorVest, Inc.)
- Trading as a Business Workshop
- VectorVest 7 EOD
- VectorVest 7 RealTime/IntraDay
- VectorVest AutoTester
- VectorVest Educational Services
- VectorVest OnLine
- VectorVest Options Analyzer
- VectorVest ProGraphics v6.0
- VectorVest ProTrader 7
- VectorVest RealTime Derby Tool
- VectorVest Simulator
- VectorVest Variator
- VectorVest Watchdog
- StockCharts.com, Inc.
- Candle Patterns
- Candlestick Charting Explained
- Intermarket Technical Analysis
- John Murphy on Chart Analysis
- John Murphy's Chart Pattern Recognition
- John Murphy's Market Message
- MurphyExplainsMarketAnalysis-Intermarket Analysis
- MurphyExplainsMarketAnalysis-Visual Analysis
- StockCharts.com
- Technical Analysis of the Financial Markets
- The Visual Investor
