HOT TOPICS LIST
- MACD
- Fibonacci
- RSI
- Gann
- ADXR
- Stochastics
- Volume
- Triangles
- Futures
- Cycles
- Volatility
- ZIGZAG
- MESA
- Retracement
- Aroon
INDICATORS LIST
LIST OF TOPICS
PRINT THIS ARTICLE
by Paolo Pezzutti
New medium-term highs are printed in a record low-volatility environment and with multiple MACD divergences.
Position: N/A
Paolo Pezzutti
Author of the book "Trading the US Markets - A Comprehensive Guide to US Markets for International Traders and Investors" - Harriman House (July 2008)
PRINT THIS ARTICLE
VOLATILITY
S&P Index: The Risk Is Getting Higher For Bulls
12/02/05 12:12:01 PMby Paolo Pezzutti
New medium-term highs are printed in a record low-volatility environment and with multiple MACD divergences.
Position: N/A
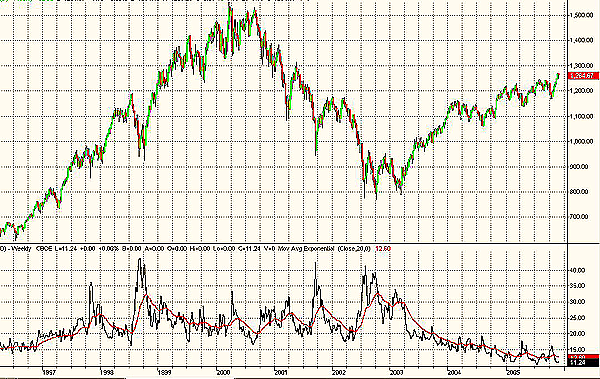
| Since the lows of 2002, the S&P Index has advanced more than 50%. In Figure 1, you can see the weekly chart of $SPX. During the past three years, the market has been recovering from the end of the 1990s bubble, printing an uptrend that in the case of $SPX partially gave back the losses suffered between 2000 and 2002. I will use the VIX, the volatility index of the Chicago Board Options Exchange (CBOE), to support the technical analysis in this time frame. |

|
| FIGURE 1: VIX, WEEKLY. A long-term weekly chart displays the VIX behavior. Panic-selling lows are characterized by peaks of the indicator. The last three years printed a diminishing volatility environment. |
| Graphic provided by: TradeStation. |
| |
| The VIX is a measure of the implied volatility of a range of options based on the S&P 500. It reflects investors' assessment of near-term market volatility, or risk. If implied volatility is high, the premium on options will be high and reflect rising expectation of future volatility of the stock index. Generally, it is believed that a high VIX displays increased investor fear and a low VIX suggests complacency. Historically, this pattern in the relationship between the VIX and the stock market has repeated itself in bull and bear cycles. During bear market periods, the VIX spiked higher, reflecting the high demand for puts as a hedge against declines. During bullish periods, there is less need for portfolio managers to purchase puts. Many traders use the VIX as a contrarian tool in attempting to pinpoint market tops and bottoms. Volatility is at its lowest levels since 1993. Since 2002, the decline of volatility has been precipitous. The uptrend developed with diminishing volatility. The recent tops were printed in a record low-volatility environment. This would anticipate the expectation of a bear market ahead. |

|
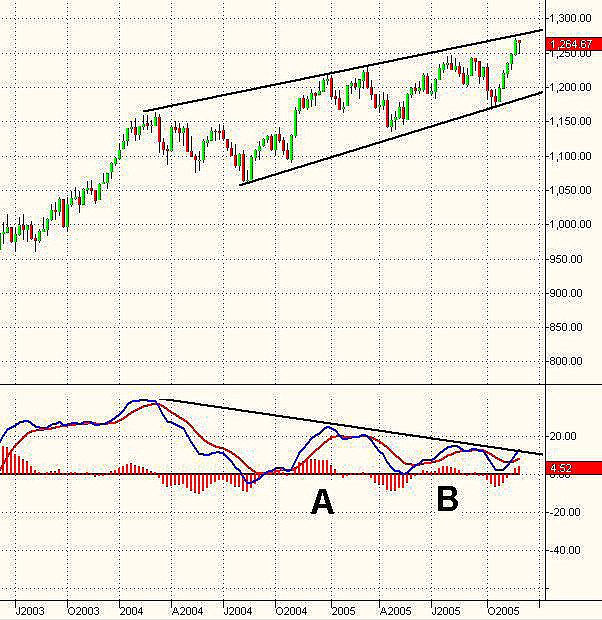
| FIGURE 2: $SPX. The medium-term chart of $SPX shows multiple negative divergences of MACD. |
| Graphic provided by: TradeStation. |
| |
| In Figure 2, you can see the moving average convergence/divergence (MACD) indicator. It calculates two exponential moving averages (EMAs). The difference between these two averages is plotted as the MACD (blue line). This value is averaged and then plotted as the MACDAvg (red line). The difference between MACD and MACD average is plotted as the MACDDiff (red histogram). Since 2004, prices have been moving within a slightly converging channel. Note that the MACD printed two negative divergences in coincidence with the December 2004 and August 2005 tops (points A and B). At present, prices are testing the higher trendline and momentum is low. |

|
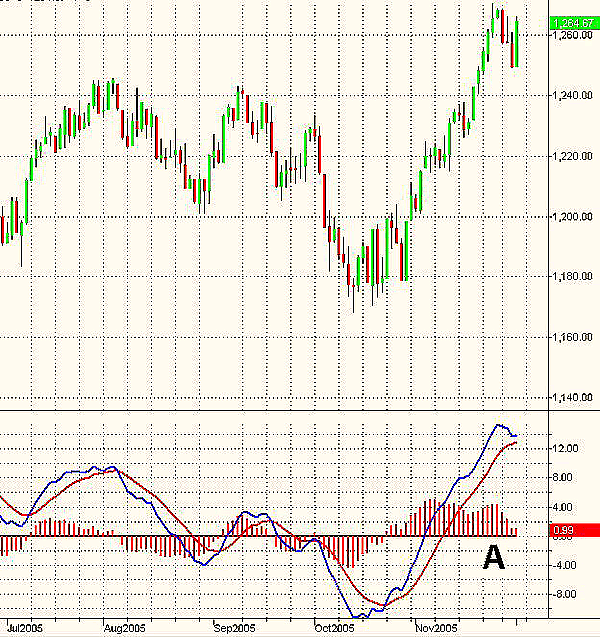
| FIGURE 3: MACDIFF. The last top displayed a MACDiff negative divergence (point A). |
| Graphic provided by: TradeStation. |
| |
| At the daily level, in Figure 3, you can see that the November 23rd high was accompanied by a MACD high, but the MACDiff printed a negative divergence (point A). The December 1st trading session printed a wide range bar that addressed a possible retest of the previous high and places an important support level at about 1249. |
| Divergences alone cannot state the end of a trend. They do not provide a reliable trading signal. You can have many false signals before you have a correct indication. They are, however, a useful tool for traders to assess the risk of entering long positions when multiple divergences occur. Looking at the volatility situation, my view is that most of the time, a directional impulse brings volatility in the direction of the trend. For example, the top in 2000 was reached in a high-volatility environment and the crash that followed printed a spike in volatility in 2001 and 2002. There might be an ongoing change in the market, providing a lower-volatility structure than in the past, but volatility is quite cyclical in its nature. At the moment, the market is not showing signs of increasing volatility, although it appears to be more "news-driven" than in the past months. Provided that the uptrend is still intact, it is difficult not to participate in the current up phase. There are elements, however, to believe that the risk of entering long positions at these levels is getting higher. Trying to spot lower-risk entry points should a correction or consolidation phase develop could be an option. |
Author of the book "Trading the US Markets - A Comprehensive Guide to US Markets for International Traders and Investors" - Harriman House (July 2008)
| Address: | VIA ROBERTO AGO 26 POSTAL CODE 00166 |
| Rome, ITALY | |
| Phone # for sales: | +393357540708 |
| E-mail address: | pezzutti.paolo@tiscali.it |
Click here for more information about our publications!
Comments
Date: 12/04/05Rank: 3Comment:

|

Request Information From Our Sponsors
- StockCharts.com, Inc.
- Candle Patterns
- Candlestick Charting Explained
- Intermarket Technical Analysis
- John Murphy on Chart Analysis
- John Murphy's Chart Pattern Recognition
- John Murphy's Market Message
- MurphyExplainsMarketAnalysis-Intermarket Analysis
- MurphyExplainsMarketAnalysis-Visual Analysis
- StockCharts.com
- Technical Analysis of the Financial Markets
- The Visual Investor
- VectorVest, Inc.
- Executive Premier Workshop
- One-Day Options Course
- OptionsPro
- Retirement Income Workshop
- Sure-Fire Trading Systems (VectorVest, Inc.)
- Trading as a Business Workshop
- VectorVest 7 EOD
- VectorVest 7 RealTime/IntraDay
- VectorVest AutoTester
- VectorVest Educational Services
- VectorVest OnLine
- VectorVest Options Analyzer
- VectorVest ProGraphics v6.0
- VectorVest ProTrader 7
- VectorVest RealTime Derby Tool
- VectorVest Simulator
- VectorVest Variator
- VectorVest Watchdog
