HOT TOPICS LIST
- MACD
- Fibonacci
- RSI
- Gann
- ADXR
- Stochastics
- Volume
- Triangles
- Futures
- Cycles
- Volatility
- ZIGZAG
- MESA
- Retracement
- Aroon
INDICATORS LIST
LIST OF TOPICS
PRINT THIS ARTICLE
by David Penn
Bears were livid as a piercing pattern put an end to a three-day decline in Yahoo.
Position: N/A
David Penn
Technical Writer for Technical Analysis of STOCKS & COMMODITIES magazine, Working-Money.com, and Traders.com Advantage.
PRINT THIS ARTICLE
CANDLESTICK CHARTING
The Other Way Of Stopping (A Decline)
12/01/05 01:33:23 PMby David Penn
Bears were livid as a piercing pattern put an end to a three-day decline in Yahoo.
Position: N/A
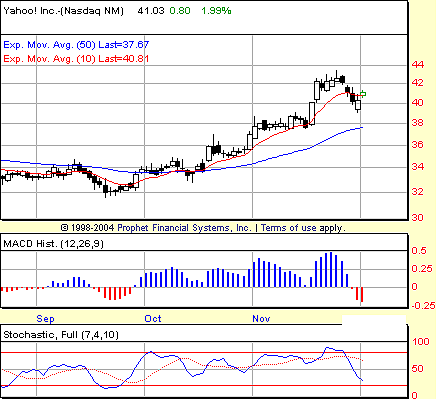
| Sometimes, there is nothing more entertaining than listening to righteous indignation. And the stones and arrows were flying fast and furious from those short-sellers who thought they could pile on Yahoo's back as the stock finished its third consecutive down day (Figure 1). |
| It's no secret that traders on the NYSE often gap a stock down at the open in order to buy it at a cheaper price. In fact, it is almost axiomatic that a gap down open is likely to lead to higher prices over the balance of the trading day. The reverse is no less true. Stocks that gap up at the open, especially after a significant advance, often tend to wind up lower by the close. |

|
| FIGURE 1: YAHOO, DAILY. Piercing patterns are a candlestick phenomenon that occurs when a market in decline creates a session that opens down and finishes up. |
| Graphic provided by: Prophet Financial, Inc. |
| |
| And no one should think that the absence of traditional market makers when it comes to the NASDAQ makes stocks like Yahoo any less susceptible to this sort of minor manipulation. In the case of Yahoo, at least as far as the woebegone short-sellers are concerned and have begun to allege, the culprit was less a cohort of cocksure traders and more the interests of institutional hands who, courtesy of a timely downgrade, provided the sort of low-risk buying opportunity that a gap down open can provide. |

|
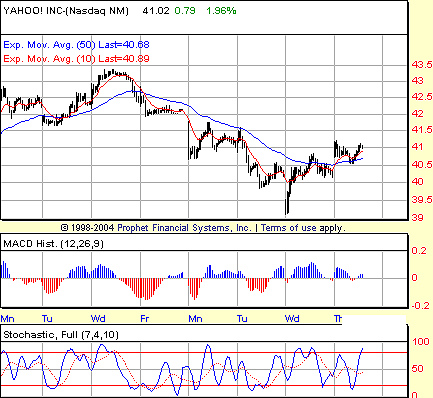
| FIGURE 2: YAHOO, 15-MINUTE CHART. The piercing pattern in Yahoo as seen in this 15-minute chart shows a running positive divergence in the stochastic indicator. As the final low is made early in the Wednesday session, positive divergences in both the stochastic and the MACD histogram become apparent as well. |
| Graphic provided by: Prophet Financial, Inc. |
| |
| The pattern these downgrades have allegedly wrought is called a piercing pattern in the language of the candlestick chartists. Piercing patterns -- at least bullish ones -- develop when a market that has been declining creates a bullish session in which prices open down, making a new low for the decline, but finish the session significantly higher. Unlike a bullish engulfing pattern, the real body of the piercing candlestick will not encompass the entire range of the previous candlestick. Instead, it merely "pierces" that range. That said, the greater the degree of penetration of the previous bearish candlestick, the greater the likelihood that the piercing pattern will result in a bullish reversal. |
| It is always interesting to see the "market within the market" -- in this case, the intraday 15-minute action leading up to and including the piercing pattern. Figure 2 clearly shows the gap down open on Wednesday, November 30. But what was particularly telling was the variety of positive divergences in both the stochastic and the moving average convergence/divergence (MACD) histogram as the "gap down low" was created. Combining the axiomatic "gap down open = higher close" notion with the "market within the market" intraday action made plain in the 15-minute chart, it is clear that while things got hot quickly for Yahoo's antagonists, there really wasn't any reason for observant shorts to get burned too badly. |
Technical Writer for Technical Analysis of STOCKS & COMMODITIES magazine, Working-Money.com, and Traders.com Advantage.
| Title: | Technical Writer |
| Company: | Technical Analysis, Inc. |
| Address: | 4757 California Avenue SW |
| Seattle, WA 98116 | |
| Phone # for sales: | 206 938 0570 |
| Fax: | 206 938 1307 |
| Website: | www.Traders.com |
| E-mail address: | DPenn@traders.com |
Traders' Resource Links | |
| Charting the Stock Market: The Wyckoff Method -- Books | |
| Working-Money.com -- Online Trading Services | |
| Traders.com Advantage -- Online Trading Services | |
| Technical Analysis of Stocks & Commodities -- Publications and Newsletters | |
| Working Money, at Working-Money.com -- Publications and Newsletters | |
| Traders.com Advantage -- Publications and Newsletters | |
| Professional Traders Starter Kit -- Software | |
Click here for more information about our publications!
Comments
Date: 12/01/05Rank: 3Comment:

|

Request Information From Our Sponsors
- StockCharts.com, Inc.
- Candle Patterns
- Candlestick Charting Explained
- Intermarket Technical Analysis
- John Murphy on Chart Analysis
- John Murphy's Chart Pattern Recognition
- John Murphy's Market Message
- MurphyExplainsMarketAnalysis-Intermarket Analysis
- MurphyExplainsMarketAnalysis-Visual Analysis
- StockCharts.com
- Technical Analysis of the Financial Markets
- The Visual Investor
- VectorVest, Inc.
- Executive Premier Workshop
- One-Day Options Course
- OptionsPro
- Retirement Income Workshop
- Sure-Fire Trading Systems (VectorVest, Inc.)
- Trading as a Business Workshop
- VectorVest 7 EOD
- VectorVest 7 RealTime/IntraDay
- VectorVest AutoTester
- VectorVest Educational Services
- VectorVest OnLine
- VectorVest Options Analyzer
- VectorVest ProGraphics v6.0
- VectorVest ProTrader 7
- VectorVest RealTime Derby Tool
- VectorVest Simulator
- VectorVest Variator
- VectorVest Watchdog
