HOT TOPICS LIST
- MACD
- Fibonacci
- RSI
- Gann
- ADXR
- Stochastics
- Volume
- Triangles
- Futures
- Cycles
- Volatility
- ZIGZAG
- MESA
- Retracement
- Aroon
INDICATORS LIST
LIST OF TOPICS
PRINT THIS ARTICLE
by Gary Grosschadl
Joy Global is a worldwide mining machinery and services company. And the stock price is breaking out.
Position: Buy
Gary Grosschadl
Independent Canadian equities trader and technical analyst based in Peterborough
Ontario, Canada.
PRINT THIS ARTICLE
ASCENDING TRIANGLES
A Burst Of Joy (Global, That Is)
12/01/05 09:25:07 AMby Gary Grosschadl
Joy Global is a worldwide mining machinery and services company. And the stock price is breaking out.
Position: Buy
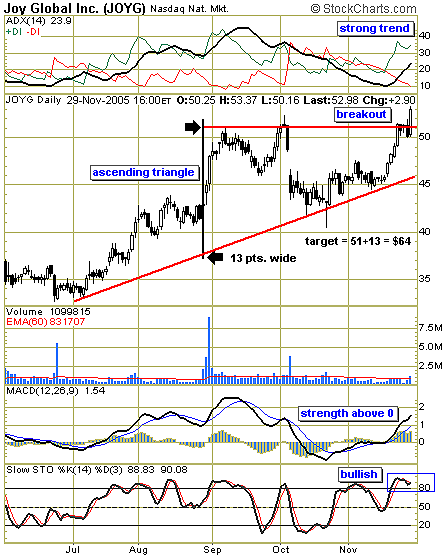
| This daily chart shows a breakout of an ascending triangle (Figure 1). These triangles have a bullish bias, but it's always wise to see which way they actually break. Breakouts should occur with larger than normal volume and although not exceptional, it is at least somewhat higher than the average volume of the past 30 days. |
| The upside target for a breakout from this pattern is $64. This matches the width of the triangle at its widest point and is applied above the upper trendline. This may not be realized in the initial thrust but can be the eventual target at a later date. These patterns can also involve a retest of the breakout level before eventually forging higher. Traders who miss initial breakouts often do get a chance to load up on the successful retest of a breakout pattern. |

|
| FIGURE 1: JOY GLOBAL, DAILY. This daily chart hints at a promising breakout. |
| Graphic provided by: StockCharts.com. |
| |
| Three indicators displayed here also reflect the bullish tone. At the top of the chart, the average directional movement index (ADX) has a good upslope moving above the 20 region. This shows growing trend strength. Some traders prefer to see this ADX level, currently 23.9, above 25 before acknowledging that a strong trend is in place. |
| Below the chart, the moving average convergence/divergence (MACD) shows a similar healthy upslope above the zero line. The last time this occurred, the stock ran from $36 to $50. The stochastics oscillator is in overbought territory, but it is hinting at a slight upturn that may lead to this indicator "sticking high." When a strong trend is in place, this oscillator can stay overbought for extended periods. |
| Should this prove to be a false breakout, then a move back inside the triangle would be in order. Until that happens, shareholders may relish in some joyful gains. |
Independent Canadian equities trader and technical analyst based in Peterborough
Ontario, Canada.
| Website: | www.whatsonsale.ca/financial.html |
| E-mail address: | gwg7@sympatico.ca |
Click here for more information about our publications!
Comments
Date: 12/01/05Rank: 5Comment:

Request Information From Our Sponsors
- StockCharts.com, Inc.
- Candle Patterns
- Candlestick Charting Explained
- Intermarket Technical Analysis
- John Murphy on Chart Analysis
- John Murphy's Chart Pattern Recognition
- John Murphy's Market Message
- MurphyExplainsMarketAnalysis-Intermarket Analysis
- MurphyExplainsMarketAnalysis-Visual Analysis
- StockCharts.com
- Technical Analysis of the Financial Markets
- The Visual Investor
- VectorVest, Inc.
- Executive Premier Workshop
- One-Day Options Course
- OptionsPro
- Retirement Income Workshop
- Sure-Fire Trading Systems (VectorVest, Inc.)
- Trading as a Business Workshop
- VectorVest 7 EOD
- VectorVest 7 RealTime/IntraDay
- VectorVest AutoTester
- VectorVest Educational Services
- VectorVest OnLine
- VectorVest Options Analyzer
- VectorVest ProGraphics v6.0
- VectorVest ProTrader 7
- VectorVest RealTime Derby Tool
- VectorVest Simulator
- VectorVest Variator
- VectorVest Watchdog
