HOT TOPICS LIST
- MACD
- Fibonacci
- RSI
- Gann
- ADXR
- Stochastics
- Volume
- Triangles
- Futures
- Cycles
- Volatility
- ZIGZAG
- MESA
- Retracement
- Aroon
INDICATORS LIST
LIST OF TOPICS
PRINT THIS ARTICLE
by Koos van der Merwe
With gold moving above $500 per ounce for a brief intraday moment, gold bugs became excited, but on November 11, in a Traders.com article on gold, I wrote...
Position: Buy
Koos van der Merwe
Has been a technical analyst since 1969, and has worked as a futures and options trader with First Financial Futures in Johannesburg, South Africa.
PRINT THIS ARTICLE
TRIANGLES
All That Glitters
12/01/05 08:42:34 AMby Koos van der Merwe
With gold moving above $500 per ounce for a brief intraday moment, gold bugs became excited, but on November 11, in a Traders.com article on gold, I wrote...
Position: Buy
To conclude, although the monthly chart has broken above a major resistance level, its indicator is suggesting that the major trend is down. However, a divergence could once again occur with the gold price making new highs, while the RSI [relative strength index] shows lower highs. |
| ... And I was right with the first paragraph and wrong with the second. My charts suggested one thing, and very soon proved that all that glitters truly can be gold. With gold at these levels, many of the smaller mining exploration companies are finding it profitable to continue drilling their holes of hope. |
| One company that captured my attention because of its chart is Minco Mining and Metals. Minco is a Canadian mining company involved in the direct acquisition and development of high-grade gold, silver, and base metals properties in China. Since 1994, Minco has evaluated more than 400 properties in China from which it has acquired an outstanding portfolio of high-quality advanced and exploration stage properties. Okay, so we all know that China is growing voraciously and that mining companies are exploring the country for minerals with a fine-tooth comb, but find the company that offers more than a suitcase of rocks and a drill hole of hope can be a challenge. Minco is one company that may meet that challenge. |

|
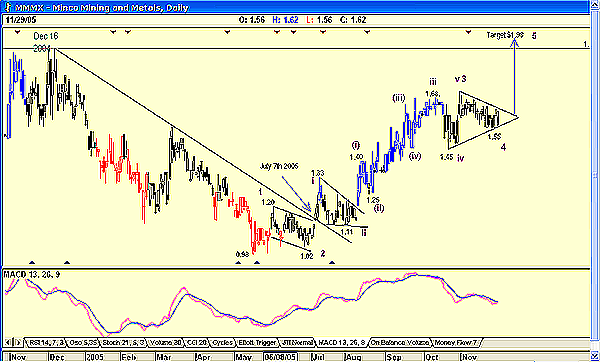
| FIGURE 1: MINCO MINING. Is this stock truly glittering? |
| Graphic provided by: AdvancedGET. |
| |
| Figure 1 is a daily chart of Minco and shows how the price broke above the resistance line on a gap and after tracing a flag pattern on July 7, 2005. The target from this pattern is $1.24 and is calculated as follows. The pole into the flag is $1.20 - $0.98 = $0.22 + $1.02 (the low point of the flag) = $1.24. The price rose to $1.33 before correcting into a consolidation triangle. This in turn gave a target that is calculated as follows. The pole into the triangle was $1.02 to $1.33 = $0.31 added to the low of the triangle, $1.11 = $1.42. The price made its first correction at $1.40. It corrected to $1.25 and then moved up strongly to $1.68 before falling to form what looks like another consolidation triangle. This now gives a target of $1.98 ( $1.68 - $1.25 = $0.43 + $1.55 = $1.98). There is a resistance at $1.90, the pivot point of December 16, 2004, and we could well see some selling again this year at this level of profit-taking. The moving average convergence/divergence (MACD) is also suggesting that a buy signal may be in the wings. |
| Finally, I have suggested a possible wave count that looks reasonably feasible. The v-3 count could be wrong. Here I have shown wave v as a failure -- that is, where it has not risen enough above the top of wave iii, at least equal to the length of wave i. If it is incorrect, then it would mean far greater upside than the target I have shown. This is very much a stock worth watching and investing in if you are a gold bug. |
Has been a technical analyst since 1969, and has worked as a futures and options trader with First Financial Futures in Johannesburg, South Africa.
| Address: | 3256 West 24th Ave |
| Vancouver, BC | |
| Phone # for sales: | 6042634214 |
| E-mail address: | petroosp@gmail.com |
Click here for more information about our publications!
Comments
Date: 12/01/05Rank: 3Comment:

|

Request Information From Our Sponsors
- StockCharts.com, Inc.
- Candle Patterns
- Candlestick Charting Explained
- Intermarket Technical Analysis
- John Murphy on Chart Analysis
- John Murphy's Chart Pattern Recognition
- John Murphy's Market Message
- MurphyExplainsMarketAnalysis-Intermarket Analysis
- MurphyExplainsMarketAnalysis-Visual Analysis
- StockCharts.com
- Technical Analysis of the Financial Markets
- The Visual Investor
- VectorVest, Inc.
- Executive Premier Workshop
- One-Day Options Course
- OptionsPro
- Retirement Income Workshop
- Sure-Fire Trading Systems (VectorVest, Inc.)
- Trading as a Business Workshop
- VectorVest 7 EOD
- VectorVest 7 RealTime/IntraDay
- VectorVest AutoTester
- VectorVest Educational Services
- VectorVest OnLine
- VectorVest Options Analyzer
- VectorVest ProGraphics v6.0
- VectorVest ProTrader 7
- VectorVest RealTime Derby Tool
- VectorVest Simulator
- VectorVest Variator
- VectorVest Watchdog
