HOT TOPICS LIST
- MACD
- Fibonacci
- RSI
- Gann
- ADXR
- Stochastics
- Volume
- Triangles
- Futures
- Cycles
- Volatility
- ZIGZAG
- MESA
- Retracement
- Aroon
INDICATORS LIST
LIST OF TOPICS
PRINT THIS ARTICLE
by Gary Grosschadl
The stock of Alcan, the world's second-largest producer of primary aluminum, may be entering a bullish phase.
Position: N/A
Gary Grosschadl
Independent Canadian equities trader and technical analyst based in Peterborough
Ontario, Canada.
PRINT THIS ARTICLE
CUP WITH HANDLE
Alcan Aluminium Making A Move
11/30/05 07:40:52 AMby Gary Grosschadl
The stock of Alcan, the world's second-largest producer of primary aluminum, may be entering a bullish phase.
Position: N/A
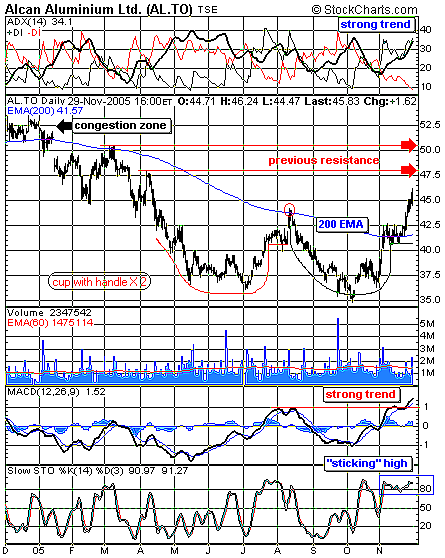
| Figure 1, the daily chart of Alcan Aluminium, shows a long bottoming phase that has finally moved above a major line of resistance. Note how the ever-important 200-day exponential moving average (EMA) has acted as a natural trendline since January 2005. After a period of consolidation around the 200-day EMA, the stock has thrusted upward. |
| The bottom pattern is interesting. It takes the form of two successive cup-with-handle patterns. The first breakout attempt ended with failure at formidable overhead resistance offered by the 200-day EMA. Now, three months later, a second attempt has evolved with apparent success. Ideal breakouts come with exceptional volume, but that is lacking here. Nevertheless, the price pattern so far is a success. |

|
| FIGURE 1: ALCAN, DAILY. This chart shows an interesting bottoming pattern that may have the stock heading upward. |
| Graphic provided by: StockCharts.com. |
| |
| The displayed indicators also reflect a strong move above the 200-day EMA. At the top of the chart, once the average directional movement index (ADX) moved above the 20-25 region, a very strong trend was in place. Meanwhile, the moving average convergence/divergence (MACD) reflected its own bullish charge as it moved above its O line and then past the previous peak from last August. The stochastics oscillator also showed extreme bullishness as this indicator remained high. In strong trending markets, this oscillator has the capacity to stay in overbought territory for an extended time, as this graph shows. |
| As we look ahead, there are several areas of concern on the chart when it comes to likely overhead resistance -- specifically, $48 and 50.50, marking previous rally highs and then likely heavy resistance at a previous congestion zone ~ $52. Consolidation or reversal at those areas is a possibility. A bigger move may still evolve, but a retest of the breakout zone back at the 200-day EMA should not be ruled out either. All things considered, however, the bottom should be in. |
Independent Canadian equities trader and technical analyst based in Peterborough
Ontario, Canada.
| Website: | www.whatsonsale.ca/financial.html |
| E-mail address: | gwg7@sympatico.ca |
Click here for more information about our publications!
Comments
Date: 12/01/05Rank: 5Comment:

Request Information From Our Sponsors
- VectorVest, Inc.
- Executive Premier Workshop
- One-Day Options Course
- OptionsPro
- Retirement Income Workshop
- Sure-Fire Trading Systems (VectorVest, Inc.)
- Trading as a Business Workshop
- VectorVest 7 EOD
- VectorVest 7 RealTime/IntraDay
- VectorVest AutoTester
- VectorVest Educational Services
- VectorVest OnLine
- VectorVest Options Analyzer
- VectorVest ProGraphics v6.0
- VectorVest ProTrader 7
- VectorVest RealTime Derby Tool
- VectorVest Simulator
- VectorVest Variator
- VectorVest Watchdog
- StockCharts.com, Inc.
- Candle Patterns
- Candlestick Charting Explained
- Intermarket Technical Analysis
- John Murphy on Chart Analysis
- John Murphy's Chart Pattern Recognition
- John Murphy's Market Message
- MurphyExplainsMarketAnalysis-Intermarket Analysis
- MurphyExplainsMarketAnalysis-Visual Analysis
- StockCharts.com
- Technical Analysis of the Financial Markets
- The Visual Investor
