HOT TOPICS LIST
- MACD
- Fibonacci
- RSI
- Gann
- ADXR
- Stochastics
- Volume
- Triangles
- Futures
- Cycles
- Volatility
- ZIGZAG
- MESA
- Retracement
- Aroon
INDICATORS LIST
LIST OF TOPICS
PRINT THIS ARTICLE
by David Penn
Do the looming negative divergences in semiconductor stocks make for a buying opportunity?
Position: N/A
David Penn
Technical Writer for Technical Analysis of STOCKS & COMMODITIES magazine, Working-Money.com, and Traders.com Advantage.
PRINT THIS ARTICLE
CHART ANALYSIS
November Divergences
11/29/05 11:15:15 AMby David Penn
Do the looming negative divergences in semiconductor stocks make for a buying opportunity?
Position: N/A
| Traders, speculators, and investors can be forgiven for the acute sense of deja vu they must be experiencing in November 2005. After all, didn't the market end a bearish streak in October last year, turning on a dime and soaring higher over the course of the following month? |
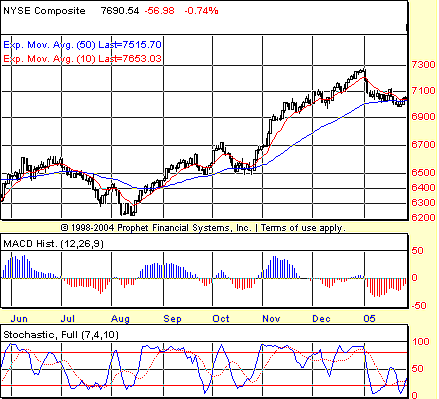
| Different years and different rallies have emerged out of different bearish conditions, but the potential for a happy ending is palpable among investors. In some ways, it appears as if a perfect storm of short-covering and seasonality has done for 2005 what the prospect of a referendum on national political leadership did in 2004. Given the gale force of October lows that weren't nearly as low as some expected and the combination of the pre-Thanksgiving week, end-of-the-month window dressing, and the hopes of retailers springing eternal as the December holiday season nears (see Figure 1), what bear in his or her right mind would have tried spitting into THAT wind? |

|
| FIGURE 1: NYSE, DAILY. A happy ending for 2004 revealed itself as stocks rallied from a mild October correction to make new highs for the year in November and December. |
| Graphic provided by: Prophet Financial, Inc. |
| |
| "That wind" has brought the major stock indexes to or near multiyear highs in the autumn of 2005 -- a feat that would have seemed virtually impossible a little over a year ago, when stocks were mired in the bear market of the first half of 2004. But to the consternation of bears and underinvested bulls, what goes up often continues to go up. And the autumn rally of 2005 has shown little inclination to pause in order to let these latecomers on board without paying a premium on the fare. |

|
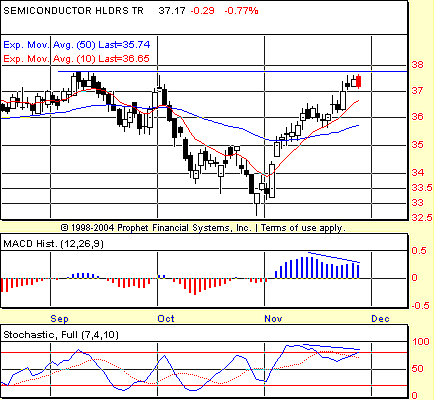
| FIGURE 2: HOLDRS, DAILY SEMICONDUCTOR. Negative divergences developed in both the MACD histogram and the stochastic in late 2005 as the SMH approached potential resistance at the October and September highs. |
| Graphic provided by: Prophet Financial, Inc. |
| |
| Or have those inclinations changed? However it has been expected, the post-holiday stall in the markets has many speculators wondering whether the pause they have been hoping for has arrived, to say nothing of a more meaningful pullback that might make bargains out of merchandise that not too long ago only seemed capable of increasing in value. While the strength of the preceding rally has precious few daring to utter the "T" word (that is, "top"), objective observers are wondering just how much of a correction the markets will pursue and, more important, what sort of buying opportunity might lie on the other side. |
| The chart of the semiconductor HOLDRS (SMH) provides, perhaps, a clue (Figure 2). SMH has developed clear negative divergences in both the moving average convergence/divergence (MACD) histogram and the stochastic. Recall that negative divergences occur when prices make new highs, but indicators refuse to confirm those new highs with new highs of their own. Negative divergences don't always result in major or sharp corrections. Sometimes, the result of a negative divergence is as mild as a sideways drift in prices. As such, negative divergences in bull markets -- or even just rallies such as the one that began in October -- can often help traders pinpoint the sort of pullbacks they need in order to make low-risk/high-reward entries in otherwise runaway advances in the markets. |
Technical Writer for Technical Analysis of STOCKS & COMMODITIES magazine, Working-Money.com, and Traders.com Advantage.
| Title: | Technical Writer |
| Company: | Technical Analysis, Inc. |
| Address: | 4757 California Avenue SW |
| Seattle, WA 98116 | |
| Phone # for sales: | 206 938 0570 |
| Fax: | 206 938 1307 |
| Website: | www.Traders.com |
| E-mail address: | DPenn@traders.com |
Traders' Resource Links | |
| Charting the Stock Market: The Wyckoff Method -- Books | |
| Working-Money.com -- Online Trading Services | |
| Traders.com Advantage -- Online Trading Services | |
| Technical Analysis of Stocks & Commodities -- Publications and Newsletters | |
| Working Money, at Working-Money.com -- Publications and Newsletters | |
| Traders.com Advantage -- Publications and Newsletters | |
| Professional Traders Starter Kit -- Software | |
Click here for more information about our publications!
Comments
Date: 12/04/05Rank: 3Comment:

Request Information From Our Sponsors
- StockCharts.com, Inc.
- Candle Patterns
- Candlestick Charting Explained
- Intermarket Technical Analysis
- John Murphy on Chart Analysis
- John Murphy's Chart Pattern Recognition
- John Murphy's Market Message
- MurphyExplainsMarketAnalysis-Intermarket Analysis
- MurphyExplainsMarketAnalysis-Visual Analysis
- StockCharts.com
- Technical Analysis of the Financial Markets
- The Visual Investor
- VectorVest, Inc.
- Executive Premier Workshop
- One-Day Options Course
- OptionsPro
- Retirement Income Workshop
- Sure-Fire Trading Systems (VectorVest, Inc.)
- Trading as a Business Workshop
- VectorVest 7 EOD
- VectorVest 7 RealTime/IntraDay
- VectorVest AutoTester
- VectorVest Educational Services
- VectorVest OnLine
- VectorVest Options Analyzer
- VectorVest ProGraphics v6.0
- VectorVest ProTrader 7
- VectorVest RealTime Derby Tool
- VectorVest Simulator
- VectorVest Variator
- VectorVest Watchdog
