HOT TOPICS LIST
- MACD
- Fibonacci
- RSI
- Gann
- ADXR
- Stochastics
- Volume
- Triangles
- Futures
- Cycles
- Volatility
- ZIGZAG
- MESA
- Retracement
- Aroon
INDICATORS LIST
LIST OF TOPICS
PRINT THIS ARTICLE
by Gary Grosschadl
A Euro Index bounce could reflect the US Dollar Index and the major US indexes topping.
Position: Buy
Gary Grosschadl
Independent Canadian equities trader and technical analyst based in Peterborough
Ontario, Canada.
PRINT THIS ARTICLE
MOVING AVERAGES
Euro Index Hits A Milestone, Warning Of A Possible US Market Turn
11/29/05 08:06:38 AMby Gary Grosschadl
A Euro Index bounce could reflect the US Dollar Index and the major US indexes topping.
Position: Buy
| Any trader who has in the past compared the Euro Index to the US Dollar Index would have noticed the near-mirror image correlation. When one of these currencies runs hard in one direction, the other is going the opposite way. This is useful to know because watching the two charts in tandem helps traders spot a market turn easier. If you wonder whether the US markets are toppy and ready to turn down, you should check out what the situation is in the Euro Index. Currency trading dwarfs the equities markets, so currency traders placing heavy bets are most likely behind this type of market action. |
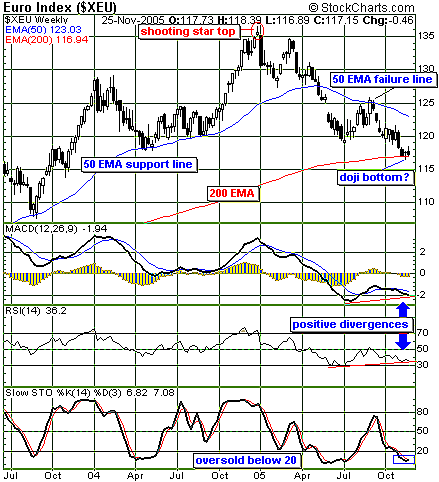
| Major candlestick patterns often mark important turning points and several can be found on Figure 1, two of which I will discuss. This weekly chart peaked with a shooting star top. This candlestick, with its small body and long upper shadow, often marks a top in the market, and this held true on this chart. Now we have another major candlestick pattern marking a possible bottom -- a doji candlestick. With its signature small cross, this candlestick is well known for marking major turning points at tops and bottoms. The open and close is identical or nearly so, hinting at indecision between bears and bulls. This often is the first sign of a trend change via a loss in momentum in the previous trend. |

|
| FIGURE 1: EURO INDEX, WEEKLY. This chart of the Euro Index shows possible a turning point at its 200-period moving average. |
| Graphic provided by: StockCharts.com. |
| |
| There are other signs lending credence to a possible bounce. Note how the doji candlestick has found 200-period exponential moving average (EMA) support. The 200-period EMA often acts as a very strong level of support or resistance. Two positive divergences are depicted. Both the moving average convergence/divergence (MACD) and the relative strength index (RSI) fail to confirm the lower move of the chart's price action. This points to the likelihood that a bounce is forthcoming. Meanwhile, the stochastic oscillator is in oversold territory. Uplegs most often originate as this oscillator turns up from below 20. |
| Should this doji bottom hold, the first upside target or test would be the 50-period EMA. Indexes or stocks under pressure can find stiff overhead resistance from major moving averges. Note how this 50-period EMA acted as a significant support line during the previous upleg. Now the danger is that it can be a signicant "failure line," or overhead resistance. Whether this is a major turning point or merely a bear rally to overhead resistance, only the market knows for sure. |
Independent Canadian equities trader and technical analyst based in Peterborough
Ontario, Canada.
| Website: | www.whatsonsale.ca/financial.html |
| E-mail address: | gwg7@sympatico.ca |
Click here for more information about our publications!
Comments
Date: 12/04/05Rank: 5Comment:

Request Information From Our Sponsors
- StockCharts.com, Inc.
- Candle Patterns
- Candlestick Charting Explained
- Intermarket Technical Analysis
- John Murphy on Chart Analysis
- John Murphy's Chart Pattern Recognition
- John Murphy's Market Message
- MurphyExplainsMarketAnalysis-Intermarket Analysis
- MurphyExplainsMarketAnalysis-Visual Analysis
- StockCharts.com
- Technical Analysis of the Financial Markets
- The Visual Investor
- VectorVest, Inc.
- Executive Premier Workshop
- One-Day Options Course
- OptionsPro
- Retirement Income Workshop
- Sure-Fire Trading Systems (VectorVest, Inc.)
- Trading as a Business Workshop
- VectorVest 7 EOD
- VectorVest 7 RealTime/IntraDay
- VectorVest AutoTester
- VectorVest Educational Services
- VectorVest OnLine
- VectorVest Options Analyzer
- VectorVest ProGraphics v6.0
- VectorVest ProTrader 7
- VectorVest RealTime Derby Tool
- VectorVest Simulator
- VectorVest Variator
- VectorVest Watchdog
