HOT TOPICS LIST
- MACD
- Fibonacci
- RSI
- Gann
- ADXR
- Stochastics
- Volume
- Triangles
- Futures
- Cycles
- Volatility
- ZIGZAG
- MESA
- Retracement
- Aroon
INDICATORS LIST
LIST OF TOPICS
PRINT THIS ARTICLE
by Paolo Pezzutti
The growth strategy provided very good returns to investors in the long term.
Position: N/A
Paolo Pezzutti
Author of the book "Trading the US Markets - A Comprehensive Guide to US Markets for International Traders and Investors" - Harriman House (July 2008)
PRINT THIS ARTICLE
TECHNICAL ANALYSIS
The Biotech Index: A Long-Term Opportunity
11/28/05 09:20:00 AMby Paolo Pezzutti
The growth strategy provided very good returns to investors in the long term.
Position: N/A
| When investors started to pour money into the biotech sector 10 years ago, they were aware of the high risk factor, deriving from the fact that biotech was still an emerging sector. The industry had to demonstrate that it could be profitable and provide adequate returns to investors. In the long term, however, following a growth strategy can be a winning approach to markets. The breakthrough in information technology began a new era for investors. In the markets, the Internet bubble represented the climax of the investors' positive sentiment. Biotechnology could represent a technological breakthrough with a significant impact on our economies and lifestyle. What is the markets' sentiment in this regard? |

|
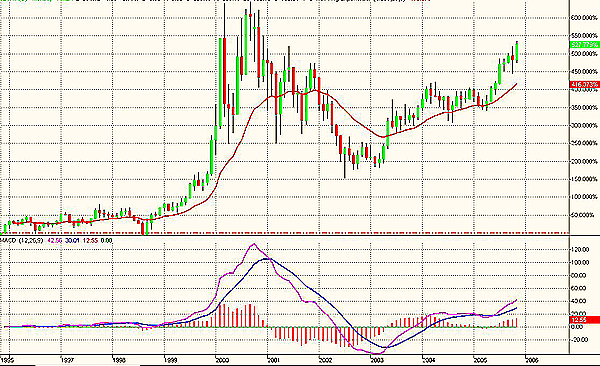
| FIGURE 1: $BTK. The Biotechnology Index provided very good returns to investors in the past 10 years. It is close to all-time highs currently. |
| Graphic provided by: TradeStation. |
| |
| Let's look at a long-term chart of the Biotechnology Index ($BTK) in Figure 1. Those who invested in 1995 in biotech and remained in the market gained a more than respectable 530%. In comparison, the Pharmaceutical Index ($DRG) did not perform as well, gaining only about 120%. The Biotech Index participated in the euphoria of the end of the 1990s, reaching a top in September 2000 in a very high volatility environment. The following two-year downtrend cut much of the gains and brought prices to the end of 1999 levels. Note, however, that during the past three years the index developed an impressive rally, moving from a low of about 275 to the present 680 level. Today, prices are very close to the top in 2000! I used the moving average convergence/divergence (MACD) to assess the technical situation. It calculates two exponential moving averages (EMAs). The difference between these two averages is plotted as the MACD (pink line). This value is averaged and then plotted as the MACDAvg (blue line). The difference between MACD and MACD average is plotted as the MACDDiff (red histogram). The MACD shows the ongoing trend and momentum of the Biotech Index. The MACDiff displays a negative divergence. |

|
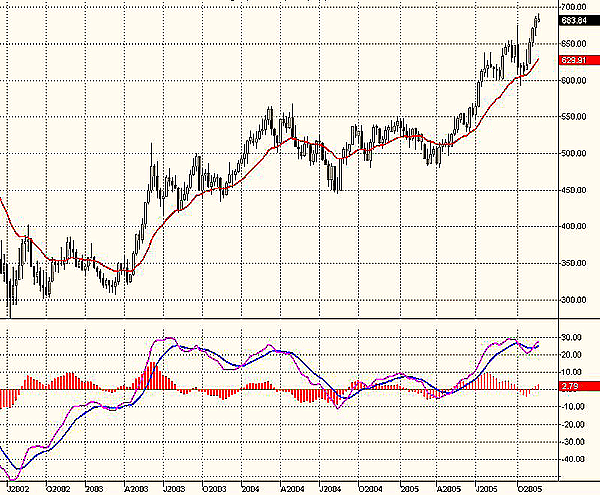
| FIGURE 2: $BTK, WEEKLY. The weekly chart displays the uptrend of the last three years. |
| Graphic provided by: TradeStation. |
| |
| In Figure 2, you can see the weekly chart of $BTK. In March 2004, a negative divergence of MACD opened a consolidation phase that lasted until April 2005, when another upleg of more than 30% began. The MACDiff signaled a negative divergence at the September 2005 top. After a fast correction in October, prices topped again on another MACDiff negative divergence. Note also that during the past four weeks of the uptrend, the range became smaller and smaller, indicating a diminishing volatility. |

|
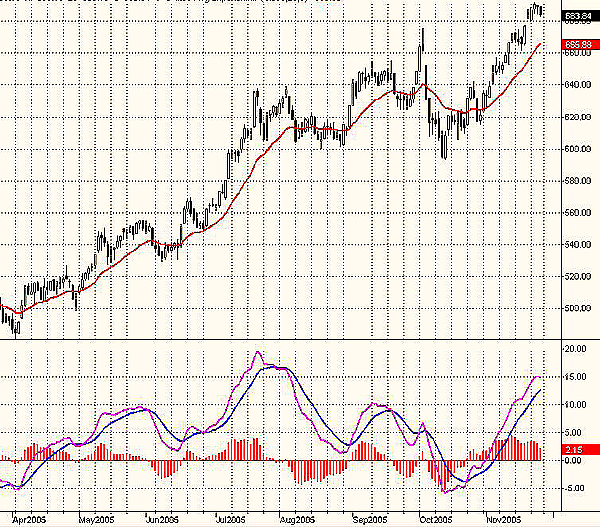
| FIGURE 3: $BTK, DAILY. Multiple negative divergences at the daily time frame signal that the risk of entering long positions at these levels is getting higher. |
| Graphic provided by: TradeStation. |
| |
| In Figure 3, the daily chart confirms the scenario displayed in the longer-term time frames. Note that the MACD signaled the August, September, and October relative highs with negative divergences. The October 4th top developed a bull trap that squeezed weak long hands, bringing prices very quickly to the October 13th low. This low has been an excellent opportunity to enter the market, printing a Turtle Soup Plus One pattern (see my May 2, 2005, article on the subject). The Biotech Index took many investors by surprise and managed to reach new highs, touching the 691 level. In addition, this top is marked by a negative divergence of MACD and MACDiff. It is useless to say that divergences alone cannot state the end of a trend. A divergence alone does not provide a reliable trading signal. You can have multiple divergences with many false indications before you have a correct signal, especially in strong trends. But they are a useful tool for traders to assess the risk of entering long positions when multiple divergences occur. |
| The case of the Biotechnology Index is an interesting one. Investors are being rewarded quite well for believing that, in the long term, growth assets can provide high returns. The monthly chart, in fact, displays a very strong ongoing trend. The same situation can be assessed at the weekly and daily levels, although there are elements to believe that the risk of entering long positions at these levels is getting higher. Provided that the uptrend is still intact and strong, I would suggest trying to spot lower-risk entry points should a correction or consolidation phase develop in the next weeks. |
Author of the book "Trading the US Markets - A Comprehensive Guide to US Markets for International Traders and Investors" - Harriman House (July 2008)
| Address: | VIA ROBERTO AGO 26 POSTAL CODE 00166 |
| Rome, ITALY | |
| Phone # for sales: | +393357540708 |
| E-mail address: | pezzutti.paolo@tiscali.it |
Click here for more information about our publications!
Comments
Date: 11/28/05Rank: 3Comment:
Date: 12/12/05Rank: 4Comment:

Request Information From Our Sponsors
- VectorVest, Inc.
- Executive Premier Workshop
- One-Day Options Course
- OptionsPro
- Retirement Income Workshop
- Sure-Fire Trading Systems (VectorVest, Inc.)
- Trading as a Business Workshop
- VectorVest 7 EOD
- VectorVest 7 RealTime/IntraDay
- VectorVest AutoTester
- VectorVest Educational Services
- VectorVest OnLine
- VectorVest Options Analyzer
- VectorVest ProGraphics v6.0
- VectorVest ProTrader 7
- VectorVest RealTime Derby Tool
- VectorVest Simulator
- VectorVest Variator
- VectorVest Watchdog
- StockCharts.com, Inc.
- Candle Patterns
- Candlestick Charting Explained
- Intermarket Technical Analysis
- John Murphy on Chart Analysis
- John Murphy's Chart Pattern Recognition
- John Murphy's Market Message
- MurphyExplainsMarketAnalysis-Intermarket Analysis
- MurphyExplainsMarketAnalysis-Visual Analysis
- StockCharts.com
- Technical Analysis of the Financial Markets
- The Visual Investor
