

HOT TOPICS LIST
- MACD
- Fibonacci
- RSI
- Gann
- ADXR
- Stochastics
- Volume
- Triangles
- Futures
- Cycles
- Volatility
- ZIGZAG
- MESA
- Retracement
- Aroon
INDICATORS LIST
LIST OF TOPICS
PRINT THIS ARTICLE
by Dennis D. Peterson
When looking at price action it can be helpful to see if recent price action has a trend and to evauate the strength of that trend. Average directional index (ADX) provides both.
Position: N/A
Dennis D. Peterson
Market index trading on a daily basis.
PRINT THIS ARTICLE
ADXR
ADX
08/07/00 03:39:03 PMby Dennis D. Peterson
When looking at price action it can be helpful to see if recent price action has a trend and to evauate the strength of that trend. Average directional index (ADX) provides both.
Position: N/A
| Wells Wilder created the average directional index (ADX) to determine if current price action is within a trend and, if so, the strength of that trend. It is built on a simple notion: is the direction of today's price indicating an up direction or down direction relative to yesterdays price? To determine if price is trending up, +DM (upward directional movement), or trending down, -DM (downward directional movement), compare the yesterday's price extremes to today's. While the actual computation is somewhat complex, it is still useful to see how some of the components of the index are built in order to understand what the index is trying to tell you. |
| The comparison calculations for +DM and -DM are based on examining the overlap between yesterday's trading range and today's. Two cases can illustrate the method of calculation. If yesterday's range for stock xyz is $20 to $30, and today's is $25 to $35, then the +DM value would be $5 ($35 minus $30). If today's range had been $20 to $30, the same as yesterday's, the +DM value would be zero. |
|
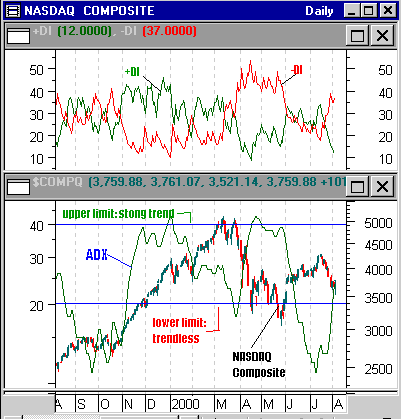
| Figure 1: The ADX is overlaid on the Nasdaq composite (lower chart). On the upper chart +DI and -DI are shown for the Nasdaq. Strong trends tend to continue and weak trends can go either up or down. |
| Graphic provided by: MetaStock. |
| |
| Next, if you are trying to get an idea of the strength of a trend then you need to compare the value of +DM to the overall trading range of the equity. For example, if stock xyz trades from $20 to $30, and +DM is $5, the +DM is 50% ($5/$10) of the trading range. If the range had been $250 to $275, and +DM had been $5, then that would be 20% of the range ($5/$25). How do you adjust for this? Enter "true range." |
| Wilder's true range (TR), as interpreted by the noted technical analysist and author Martin Pring, is the greater of either: --Today's high minus today's low, --The difference between yesterday's close and today's high, or --The difference between yesterday's close and today's low. An indicator called the directional indicator (DI) can be calculated based on the ratio betweenTR and + or -DM: +DI=+DM/TR, and -DI=-DM/TR. If a parameter of 14 days is selected then just take the sum of 14 days of +DM, -DM, and true range. Next, go through an accumulation calculation that allows you to have today's 14-day value of +DM or -DM. We now have an idea of the relative strength of the upward and downward trend. But what would be a useful comparison between +DI and -DI? Wilder chose to create the directional index (DX) which is the ratio of the difference between +DI and -DI divided by the sum of +DI and -DI: DX = (+DI- (-DI))/(+DI+(-DI)) We can now smooth the DX by taking a moving average, and so ADX is commonly the 14-day smoothed average of DX. |
| Figure 1 shows the price action of the Nasdaq composite overlaid with the ADX in the bottom chart, and both +DI and -DI for the Nasdaq composite in the upper chart. The ADX ranges between 0 and 100. Values of 20 and 40 are accepted as extreme cases, below 20 is trendless, and above 40 is a strong trend. Remember the ADX does not indicate whether a market is bullish or bearish. It is used to determine whether it is trendless or in a strong trend. Starting with September and October in 1999, you see that -DI and +DI are about equal. The Nasdaq at that time was trendless, that is, moving sideways. In the beginning of November '99 the ADX suggested a trend was developing and by late November indicated a strong trend. +DI dominated over -DI. At the beginning of 2000 the trend strength was going down. At about this time the news media was chatting about the "bubble" and asking when it was going to burst. You can see that in mid-March the market had lost half of its strength. In mid-April the strength picked up again, but was that because of the downtrend? When a stock or index is moving sideways, as seen by a low ADX number (<20), then a trendless condition exists. The Nasdaq was in such a condition from the beginning of June through mid-July. It has been noted that the longer a trendless condition continues, the more likely that it will end in a reversal rather than a continuation. A reversal did indeed occur on the Nasdaq in mid-July and was the beginning of a downtrend. In an upcoming companion article I will post the Excel formula for the ADX. |
Market index trading on a daily basis.
| Title: | Staff Writer |
| Company: | Technical Analysis, Inc. |
| Address: | 4757 California Ave SW |
| Seattle, WA 98116-4499 | |
| Phone # for sales: | 206 938 0570 |
| Fax: | 206 938 1307 |
| Website: | www.traders.com |
| E-mail address: | dpeterson@traders.com |
Traders' Resource Links | |
| Charting the Stock Market: The Wyckoff Method -- Books | |
| Working-Money.com -- Online Trading Services | |
| Traders.com Advantage -- Online Trading Services | |
| Technical Analysis of Stocks & Commodities -- Publications and Newsletters | |
| Working Money, at Working-Money.com -- Publications and Newsletters | |
| Traders.com Advantage -- Publications and Newsletters | |
| Professional Traders Starter Kit -- Software | |
Click here for more information about our publications!
Comments
Date:�/ /Rank:�4Comment:�
Date:�01/30/01Rank:�5Comment:�
Date:�01/18/02Rank:�4Comment:�
Date:�01/26/06Rank:�5Comment:�
Date:�07/15/06Rank:�4Comment:�
Date:�11/08/06Rank:�4Comment:�

Request Information From Our Sponsors
- StockCharts.com, Inc.
- Candle Patterns
- Candlestick Charting Explained
- Intermarket Technical Analysis
- John Murphy on Chart Analysis
- John Murphy's Chart Pattern Recognition
- John Murphy's Market Message
- MurphyExplainsMarketAnalysis-Intermarket Analysis
- MurphyExplainsMarketAnalysis-Visual Analysis
- StockCharts.com
- Technical Analysis of the Financial Markets
- The Visual Investor
- VectorVest, Inc.
- Executive Premier Workshop
- One-Day Options Course
- OptionsPro
- Retirement Income Workshop
- Sure-Fire Trading Systems (VectorVest, Inc.)
- Trading as a Business Workshop
- VectorVest 7 EOD
- VectorVest 7 RealTime/IntraDay
- VectorVest AutoTester
- VectorVest Educational Services
- VectorVest OnLine
- VectorVest Options Analyzer
- VectorVest ProGraphics v6.0
- VectorVest ProTrader 7
- VectorVest RealTime Derby Tool
- VectorVest Simulator
- VectorVest Variator
- VectorVest Watchdog