HOT TOPICS LIST
- MACD
- Fibonacci
- RSI
- Gann
- ADXR
- Stochastics
- Volume
- Triangles
- Futures
- Cycles
- Volatility
- ZIGZAG
- MESA
- Retracement
- Aroon
INDICATORS LIST
LIST OF TOPICS
PRINT THIS ARTICLE
by Koos van der Merwe
I bought the first MESA program sold by John Ehlers sometime in 1985-86 when I was looking for something other than Gann fans and Fourier analysis to determine cycles. That's when I first learned about John Ehlers.
Position: Accumulate
Koos van der Merwe
Has been a technical analyst since 1969, and has worked as a futures and options trader with First Financial Futures in Johannesburg, South Africa.
PRINT THIS ARTICLE
ON BALANCE VOLUME
John Ehlers And The Fisher Transform
11/28/05 10:11:22 AMby Koos van der Merwe
I bought the first MESA program sold by John Ehlers sometime in 1985-86 when I was looking for something other than Gann fans and Fourier analysis to determine cycles. That's when I first learned about John Ehlers.
Position: Accumulate
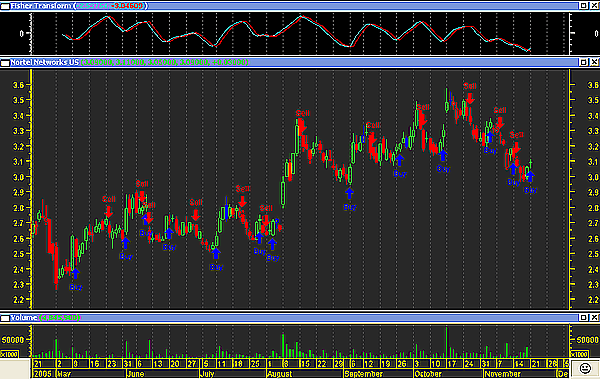
| Now, you will probably ask, "Was MESA (maximum entropy spectrum analysis) everything you expected it to be?" My answer is that I was disappointed with its predictions -- Gann fans gave better results -- but I only bought the first MESA program; I never tested later and probably more advanced programs. Where the program did help me was to introduce me to John Ehlers's body of work, with the result that anything he writes or publishes, I study intensely. Not being a mathematician, I sometimes find his writings difficult to understand, but someone somewhere on the Internet has taken the time to translate his work into MetaStock code, so it becomes simply a copy-and-paste routine, with the testing and exploration. This is how I discovered his Fisher transform program, and was surprised at the results it gave me. Figure 1 is a chart of Nortel Networks, chosen because it looks as if it may be worth investing in. The oscillator above is the Fisher transform, with the buy and sell signals -- that is when the blue line crosses the red -- superimposed as arrows on the chart. |

|
| FIGURE 1: NORTEL AND FISHER OBV. The oscillator above is the Fisher transform with buy and sell signals, when the blue crosses the red, superimposed as arrows. |
| Graphic provided by: MetaStock. |
| |
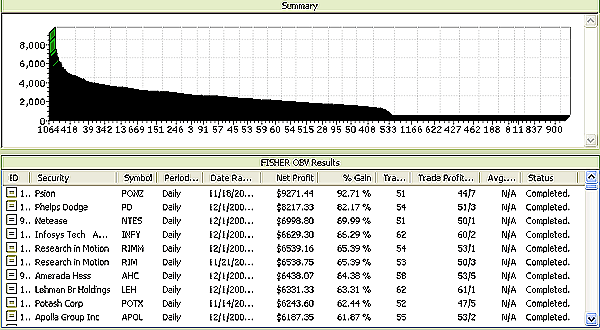
| The buy and sell signals look good, but -- and there is a but -- we would only buy the stock the day after the signal is given, so what are the profits? Because of this, I ran the enhanced system tester on 1,000 shares to see what the profit would be. The results appear in Figure 2. |

|
| FIGURE 2: ENHANCED SYSTEM TESTER |
| Graphic provided by: MetaStock. |
| |
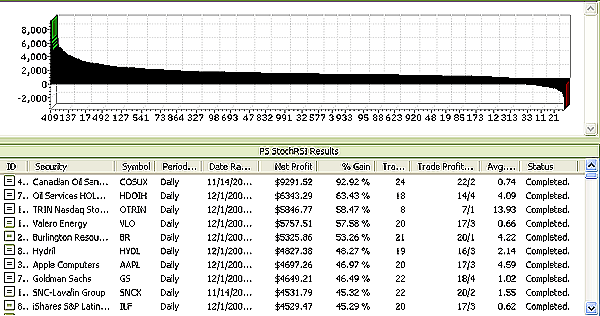
| As you can see, the profits were remarkable, and what surprised me even more is that there were no losses. The exploration did not include a commission charge, but did allow for a 50% margin. When I included a $17 charge, the top net profit was a gain of only 59.35% compared to the 92.71% shown. The number of trades were 24 compared to 51, and the biggest loser was -28.25% on 13 trades. I chose a $17 commission charge because that is what one of the Canadian daytrading companies charge in Canada. To help me decide whether this was a winning strategy, I then ran an exploration over the same number of shares and with the same parameters using the stochastic relative strength index (RSI). The top profit maker was Canadian Oil Sands with a 92.92% profit, far better than with the Fisher on-balance volume (OBV) strategy, but losses did occur, as you can see in Figure 3. |

|
| FIGURE 3: STOCHASTIC RSI. Here are the statistics for the stochastic RSI exploration. |
| Graphic provided by: MetaStock. |
| |
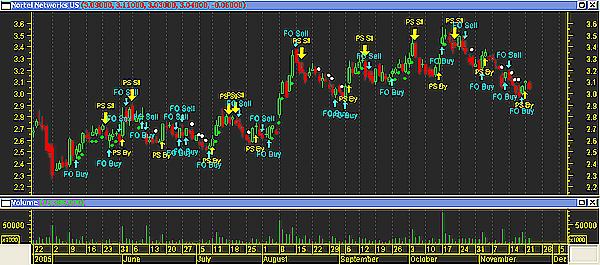
| So the answer is to combine the two, and I have done that as shown in Figure 4. I formulated both strategies into the Expert Advisor, so that I may see buy and sell signals on the chart. |

|
| FIGURE 4: COMBINING THE TWO. Both indicators are plotted on this chart using Expert Advisor. |
| Graphic provided by: MetaStock. |
| |
| And so one plays and continually hunts for and tests strategies looking for the Holy Grail of trading. Good luck and good hunting! |
Has been a technical analyst since 1969, and has worked as a futures and options trader with First Financial Futures in Johannesburg, South Africa.
| Address: | 3256 West 24th Ave |
| Vancouver, BC | |
| Phone # for sales: | 6042634214 |
| E-mail address: | petroosp@gmail.com |
Click here for more information about our publications!
Comments
Date: 11/25/05Rank: 2Comment:
Date: 11/26/05Rank: Comment: More than 95% winning trades compared to losing trades looks not really possible. I really would like to see the formula and all the test parameters like the date range, because I get totally different results!
sylvain.vervoort@scarlet.be
Date: 07/20/06Rank: 3Comment:
Date: 07/23/07Rank: 4Comment:
Date: 01/25/08Rank: 5Comment:
Date: 08/27/15Rank: 5Comment:
Date: 03/03/20Rank: 3Comment: This is a little confusing. Are the Fisher and OBV indicators separately used for a buy signal, or is Fisher transform used in OBV (e.g. to smooth) to create a single strategy?

Request Information From Our Sponsors
- StockCharts.com, Inc.
- Candle Patterns
- Candlestick Charting Explained
- Intermarket Technical Analysis
- John Murphy on Chart Analysis
- John Murphy's Chart Pattern Recognition
- John Murphy's Market Message
- MurphyExplainsMarketAnalysis-Intermarket Analysis
- MurphyExplainsMarketAnalysis-Visual Analysis
- StockCharts.com
- Technical Analysis of the Financial Markets
- The Visual Investor
- VectorVest, Inc.
- Executive Premier Workshop
- One-Day Options Course
- OptionsPro
- Retirement Income Workshop
- Sure-Fire Trading Systems (VectorVest, Inc.)
- Trading as a Business Workshop
- VectorVest 7 EOD
- VectorVest 7 RealTime/IntraDay
- VectorVest AutoTester
- VectorVest Educational Services
- VectorVest OnLine
- VectorVest Options Analyzer
- VectorVest ProGraphics v6.0
- VectorVest ProTrader 7
- VectorVest RealTime Derby Tool
- VectorVest Simulator
- VectorVest Variator
- VectorVest Watchdog
