HOT TOPICS LIST
- MACD
- Fibonacci
- RSI
- Gann
- ADXR
- Stochastics
- Volume
- Triangles
- Futures
- Cycles
- Volatility
- ZIGZAG
- MESA
- Retracement
- Aroon
INDICATORS LIST
LIST OF TOPICS
PRINT THIS ARTICLE
by Arthur Hill
After breaking support in late October, the Shanghai Composite has traded flat as it gears up for its next move.
Position: N/A
Arthur Hill
Arthur Hill is currently editor of TDTrader.com, a website specializing in trading strategies, sector/industry specific breadth stats and overall technical analysis. He passed the Society of Technical Analysts (STA London) diploma exam with distinction is a Certified Financial Technician (CFTe). Prior to TD Trader, he was the Chief Technical Analyst for Stockcharts.com and the main contributor to the ChartSchool.
PRINT THIS ARTICLE
SUPPORT & RESISTANCE
Shanghai Composite Consolidates Below Support
11/23/05 11:38:49 AMby Arthur Hill
After breaking support in late October, the Shanghai Composite has traded flat as it gears up for its next move.
Position: N/A
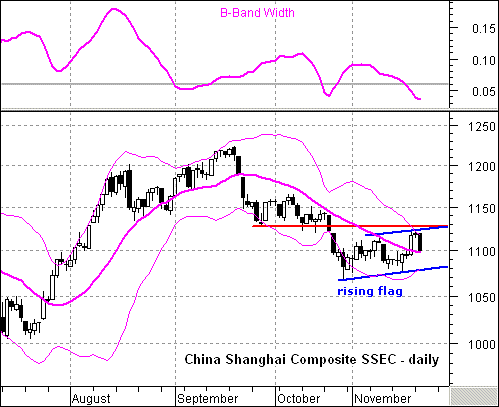
| On the daily chart (Figure 1), the index surged from mid-July to mid-September and then declined from late September to late October. The decline retraced around 62% of the prior advance, which is normal for a correction. However, the index broke an important support level at 1130 in late October. The index must recover and undo this support break to have any chance of reversing the current downtrend. |

|
| FIGURE 1: SHANGHAI COMPOSITE, DAILY. The index surged from mid-July to mid-September and then declined from late September to late October. |
| Graphic provided by: MetaStock. |
| Graphic provided by: MS QuoteCenter. |
| |
| Since breaking support, the index has traded flat the past few weeks and a rising flag has formed. This is a bearish continuation pattern that would be confirmed with a move below the mid-November low (1075). This would call for a continuation of the September-October decline and target further weakness toward the July lows around 1000. Should the November lows hold, look for a break above broken support at 1130 to revive the bulls. |
| Bollinger Band width moved to its narrowest in many months. This signals a contraction in volatility, and such contractions usually precede a move. Bollinger Bands do not offer a directional bias, but we can watch the upper and lower bands for clues. A break above the upper band would show strength and a break below the lower band would show weakness. Given the support break and the September-October decline, the odds favor a continuation and further weakness. Happy Thanksgiving! |
Arthur Hill is currently editor of TDTrader.com, a website specializing in trading strategies, sector/industry specific breadth stats and overall technical analysis. He passed the Society of Technical Analysts (STA London) diploma exam with distinction is a Certified Financial Technician (CFTe). Prior to TD Trader, he was the Chief Technical Analyst for Stockcharts.com and the main contributor to the ChartSchool.
| Title: | Editor |
| Company: | TDTrader.com |
| Address: | Willem Geetsstraat 17 |
| Mechelen, B2800 | |
| Phone # for sales: | 3215345465 |
| Website: | www.tdtrader.com |
| E-mail address: | arthurh@tdtrader.com |
Traders' Resource Links | |
| TDTrader.com has not added any product or service information to TRADERS' RESOURCE. | |
Click here for more information about our publications!
Comments
Date: 11/25/05Rank: 4Comment:

Request Information From Our Sponsors
- StockCharts.com, Inc.
- Candle Patterns
- Candlestick Charting Explained
- Intermarket Technical Analysis
- John Murphy on Chart Analysis
- John Murphy's Chart Pattern Recognition
- John Murphy's Market Message
- MurphyExplainsMarketAnalysis-Intermarket Analysis
- MurphyExplainsMarketAnalysis-Visual Analysis
- StockCharts.com
- Technical Analysis of the Financial Markets
- The Visual Investor
- VectorVest, Inc.
- Executive Premier Workshop
- One-Day Options Course
- OptionsPro
- Retirement Income Workshop
- Sure-Fire Trading Systems (VectorVest, Inc.)
- Trading as a Business Workshop
- VectorVest 7 EOD
- VectorVest 7 RealTime/IntraDay
- VectorVest AutoTester
- VectorVest Educational Services
- VectorVest OnLine
- VectorVest Options Analyzer
- VectorVest ProGraphics v6.0
- VectorVest ProTrader 7
- VectorVest RealTime Derby Tool
- VectorVest Simulator
- VectorVest Variator
- VectorVest Watchdog
