HOT TOPICS LIST
- MACD
- Fibonacci
- RSI
- Gann
- ADXR
- Stochastics
- Volume
- Triangles
- Futures
- Cycles
- Volatility
- ZIGZAG
- MESA
- Retracement
- Aroon
INDICATORS LIST
LIST OF TOPICS
PRINT THIS ARTICLE
by Gary Grosschadl
Back in the bubble years, this stock traded at $25 and the company changed Tiger Woods' legally blind (without glasses) status to 20/20 vision.
Position: Accumulate
Gary Grosschadl
Independent Canadian equities trader and technical analyst based in Peterborough
Ontario, Canada.
PRINT THIS ARTICLE
ROUND TOP & BOTTOM
TLC Laser Eye Centers Looking Like A Rebound
11/23/05 07:56:36 AMby Gary Grosschadl
Back in the bubble years, this stock traded at $25 and the company changed Tiger Woods' legally blind (without glasses) status to 20/20 vision.
Position: Accumulate
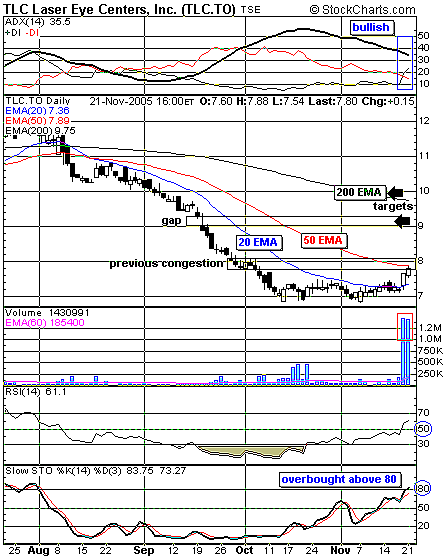
| This Canadian-based company with roots in Toronto has most of its eye vision centers in the US. In Figure 1, we may have what appears to be the formation of a rounded or saucer bottom. Though not as dramatic as a V-bottom, it is still a basing pattern that is starting to look appealing to traders. As is often the case with stocks in a long decline, its 20-period moving average acts as strong overhead resistance. Now that the stock has finally managed to close above this mark, bottom-pickers are moving in. A glance at the abnormally large volume during the last two trading sessions suggests that someone (fundmanager/insider?) is placing their bets. |
| The stock has risen to a previous congestion zone in the area of the 50-day exponential moving average (EMA) and the $8 mark. As the stochastic oscillator at the bottom of Figure 1 suggests, an overbought situation may be approaching. A hesitation could be in order here at this congestion zone, giving other traders time to mull over taking their own future positions. Should the stock find support from its rising 20-period EMA, an upleg may be under way. |

|
| FIGURE 1: TLC. This daily chart of TLC Laser Eye Centers suggests a rounding bottom may be in progress. |
| Graphic provided by: StockCharts.com. |
| |
| Two other bullish indicators are displayed. At the top of the chart, the directional movement indicator composed of three components has changed to a positive stance. With the DIs or positive/negative directional movement indicators crossing over, the bulls assume the upper hand. Should this evolve into a bigger move, this indicator will eventually assume the ideal stance where the ADX, or average directional index (representing trend strength), moves between the DIs and changes to an upslope. The other bullish sign is the relative strength indicator (RSI), which has now risen above its often key 50 level. |
| Two upside trading targets are shown via the black arrows. Previous gaps often form support or resistance levels. In this case, the level just above $9 may represent a level of profit-taking for those traders who took early positions. Beyond that, a spike up to the always important 200-day EMA is another area that traders may target. |
| And yes, more than five years after corrective surgery, Tiger Woods still sees that little white ball with 20/20 vision. |
Independent Canadian equities trader and technical analyst based in Peterborough
Ontario, Canada.
| Website: | www.whatsonsale.ca/financial.html |
| E-mail address: | gwg7@sympatico.ca |
Click here for more information about our publications!
Comments
Date: 11/25/05Rank: 5Comment:

Request Information From Our Sponsors
- VectorVest, Inc.
- Executive Premier Workshop
- One-Day Options Course
- OptionsPro
- Retirement Income Workshop
- Sure-Fire Trading Systems (VectorVest, Inc.)
- Trading as a Business Workshop
- VectorVest 7 EOD
- VectorVest 7 RealTime/IntraDay
- VectorVest AutoTester
- VectorVest Educational Services
- VectorVest OnLine
- VectorVest Options Analyzer
- VectorVest ProGraphics v6.0
- VectorVest ProTrader 7
- VectorVest RealTime Derby Tool
- VectorVest Simulator
- VectorVest Variator
- VectorVest Watchdog
- StockCharts.com, Inc.
- Candle Patterns
- Candlestick Charting Explained
- Intermarket Technical Analysis
- John Murphy on Chart Analysis
- John Murphy's Chart Pattern Recognition
- John Murphy's Market Message
- MurphyExplainsMarketAnalysis-Intermarket Analysis
- MurphyExplainsMarketAnalysis-Visual Analysis
- StockCharts.com
- Technical Analysis of the Financial Markets
- The Visual Investor
