HOT TOPICS LIST
- MACD
- Fibonacci
- RSI
- Gann
- ADXR
- Stochastics
- Volume
- Triangles
- Futures
- Cycles
- Volatility
- ZIGZAG
- MESA
- Retracement
- Aroon
INDICATORS LIST
LIST OF TOPICS
PRINT THIS ARTICLE
by David Penn
Here's a look at the autumn correction and a wave count for the November new high.
Position: N/A
David Penn
Technical Writer for Technical Analysis of STOCKS & COMMODITIES magazine, Working-Money.com, and Traders.com Advantage.
PRINT THIS ARTICLE
BROADENING FORMATION
Broads, Wedges, And Waves
11/21/05 03:40:44 PMby David Penn
Here's a look at the autumn correction and a wave count for the November new high.
Position: N/A
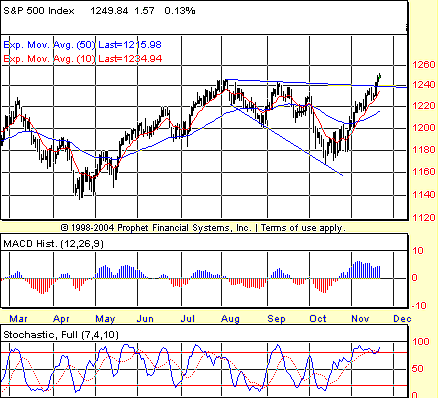
| A reader recently emailed me about my moving average convergence/divergence (MACD) histogram analysis of the Standard & Poor's 500. The reader was picking up on an observation I had picked up from the work of Alexander Elder, an observation in which I noted that MACD histogram extremes (to the upside or downside) tend to anticipate further price moves in the direction of the extreme. |
| There's more to this concept -- one I have written about often for Working Money and Traders.com Advantage. But that should suffice for the present discussion. The reader was concerned specifically about the possibility that the MACD histogram extreme in early November was signaling significantly higher prices in the S&P 500 going forward (Figure 1). |

|
| FIGURE 1: DAILY S&P 500. Broadening wedge or expanding triangle? After the index made a lower high in the MACD histogram in late November, the size of the histogram continues to suggest that higher prices will precede lower ones. |
| Graphic provided by: Prophet Financial, Inc. |
| |
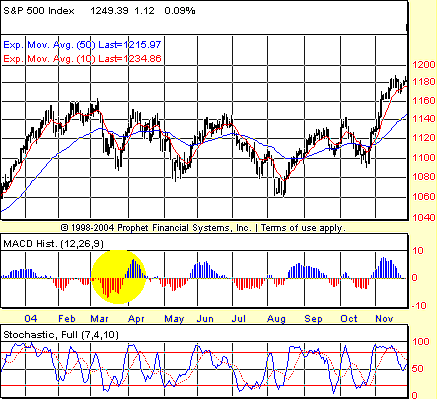
| What I suggested by way of response was the example of the 2004 market. Recall that in 2004, a sharp decline in March was followed by a strong rally in April. MACD histogram extremes (for lack of a better word) accompanied both the decline and the rally. So which extreme correctly anticipated near-term price moves? Clearly, we know now that it was the initial, bearish MACD histogram extreme to the downside in March that anticipated a bear market for much of 2004. But was there any way of knowing this in advance as the histograms were forming? I believe that context is key. By early 2004, the S&P 500 had experienced a major bull market over most of 2003. When the deeply negative MACD histogram accompanied the correction in early 2004, it was a signal that the bull market that had been in place for nearly a year was running out of steam. Because the market had already experienced a significant -- if not overwhelming -- bull market over the past several months, the MACD histogram extreme to the upside that occurred after the MACD histogram extreme to the downside was less likely an indicator of more bull market and more likely an indication of a sizable bounce or bear market rally. So how can we apply this to the market in late 2005? The MACD histogram extreme to the upside in November 2005 cannot be denied. There was some question about whether the rally that produced that strongly bullish histogram would lead to a new high, but that question has been answered in the affirmative. What is problematic about the current patterns is this: the MACD histogram extreme to the downside in October has yet to be confirmed by lower prices. Compare the extreme in October with the one in April (Figure 2). The latter produced a positive divergence and a true bull market (April to October). That positive divergence is significant because it is part of the signature of MACD histogram extremes. That is -- using the downside as an example -- a market makes a serious move downward, a move that is accompanied by a deep ("extreme") MACD histogram trough. That means that lower prices should follow, but a shallower MACD histogram trough -- sooner or later -- should accompany those lower prices. That shallower trough is what will be a part of a positive divergence in the MACD histogram as soon as a bottom is established. If you consult charts of the markets over the past century and look for major bottoms, you will be surprised at how often this is the case with the MACD histogram. |

|
| FIGURE 2: DAILY S&P 500. The MACD histogram extreme to the upside in early April was more a reaction from the bearish extreme in March than it was an indication of higher prices in 2004. That signal would not come until the bearish histograms had grown shallow by the late summer. |
| Graphic provided by: Prophet Financial, Inc. |
| |
| So the October 2005 low does not appear to be a "major" bottom based on the pattern in the MACD histogram. That, however, does not preclude higher prices, as the November histogram strongly indicates. And when coupled with what appears to be either a broadening wedge or an expanding triangle breakout in November, it appears as if the odds favor upside progress. How much progress? The measurement rule for broadening wedges is curious insofar as the highest high of the formation is considered the minimum upside target, according to Thomas Bulkowski's definitive Encyclopedia Of Chart Patterns. In some instances, instances of sharply downward wedges, this tends to mean a rally that traveled some distance from the formation. However, the current example of a broadening wedge -- assuming I have correctly spotted one here in the Standard & Poor's 500 -- suggests a far less dramatic, post-pattern, life for the S&P 500. In other words, the "minimum price objective" for the wedge has already been reached. |

|
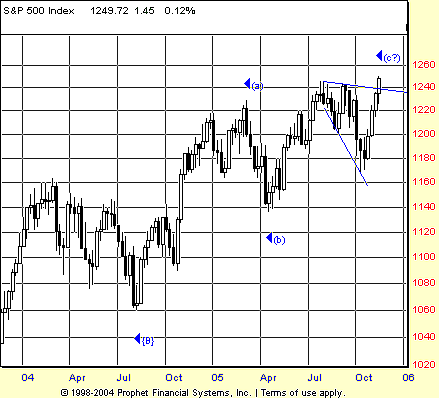
| FIGURE 3: WEEKLY S&P 500. Here is an intermediate-term wave count for the third and final “C” leg of the ABC correction from the 2002 lows. |
| Graphic provided by: Prophet Financial, Inc. |
| |
| Figure 3 provides an intermediate-term wave count that updates my last attempt at mapping the S&P 500 ("Waves Working Lower," October 18, 2005). Per this count, the S&P 500 is in the final third (the "C" part) of an ABC correction of the 2000-02 bear market. The rally up from the October lows is a fifth wave rally in Elliott wave parlance, coming off the fourth wave, the July-October correction that took the form of an expanding triangle. What do AJ Frost and Robert Prechter have to say about triangles in the fourth position? In Elliott Wave Principle, they write: A triangle always occurs in a position prior to the final actionary wave in the pattern of one larger degree ... A triangle may also occur as the final actionary pattern in a corrective combination, ... In the stock market, when a triangle occurs in the fourth wave position, wave five is sometimes swift and travels approximately the distances of the widest part of the triangle. Elliott used the word "thrust" in referring to this swift, short motive wave following a triangle. If this analysis is correct, then it suggests there will be little time for those "patient" bulls to climb on board the S&P's broadening wedge/expanding triangle breakout. If anything, bulls will find themselves chasing the S&P higher (as high as 1300, if we measure the upside potential as Frost and Prechter do) much as they had to chase it when it bottomed and reversed in late October. |
Technical Writer for Technical Analysis of STOCKS & COMMODITIES magazine, Working-Money.com, and Traders.com Advantage.
| Title: | Technical Writer |
| Company: | Technical Analysis, Inc. |
| Address: | 4757 California Avenue SW |
| Seattle, WA 98116 | |
| Phone # for sales: | 206 938 0570 |
| Fax: | 206 938 1307 |
| Website: | www.Traders.com |
| E-mail address: | DPenn@traders.com |
Traders' Resource Links | |
| Charting the Stock Market: The Wyckoff Method -- Books | |
| Working-Money.com -- Online Trading Services | |
| Traders.com Advantage -- Online Trading Services | |
| Technical Analysis of Stocks & Commodities -- Publications and Newsletters | |
| Working Money, at Working-Money.com -- Publications and Newsletters | |
| Traders.com Advantage -- Publications and Newsletters | |
| Professional Traders Starter Kit -- Software | |
Click here for more information about our publications!
Comments
Date: 11/21/05Rank: 3Comment:
Date: 11/23/05Rank: 4Comment:

Request Information From Our Sponsors
- StockCharts.com, Inc.
- Candle Patterns
- Candlestick Charting Explained
- Intermarket Technical Analysis
- John Murphy on Chart Analysis
- John Murphy's Chart Pattern Recognition
- John Murphy's Market Message
- MurphyExplainsMarketAnalysis-Intermarket Analysis
- MurphyExplainsMarketAnalysis-Visual Analysis
- StockCharts.com
- Technical Analysis of the Financial Markets
- The Visual Investor
- VectorVest, Inc.
- Executive Premier Workshop
- One-Day Options Course
- OptionsPro
- Retirement Income Workshop
- Sure-Fire Trading Systems (VectorVest, Inc.)
- Trading as a Business Workshop
- VectorVest 7 EOD
- VectorVest 7 RealTime/IntraDay
- VectorVest AutoTester
- VectorVest Educational Services
- VectorVest OnLine
- VectorVest Options Analyzer
- VectorVest ProGraphics v6.0
- VectorVest ProTrader 7
- VectorVest RealTime Derby Tool
- VectorVest Simulator
- VectorVest Variator
- VectorVest Watchdog
