HOT TOPICS LIST
- MACD
- Fibonacci
- RSI
- Gann
- ADXR
- Stochastics
- Volume
- Triangles
- Futures
- Cycles
- Volatility
- ZIGZAG
- MESA
- Retracement
- Aroon
INDICATORS LIST
LIST OF TOPICS
PRINT THIS ARTICLE
by Arthur Hill
With two big moves in as many months, the outlook for the Dow Diamonds went from bear to bull with a classic whipsaw.
Position: Accumulate
Arthur Hill
Arthur Hill is currently editor of TDTrader.com, a website specializing in trading strategies, sector/industry specific breadth stats and overall technical analysis. He passed the Society of Technical Analysts (STA London) diploma exam with distinction is a Certified Financial Technician (CFTe). Prior to TD Trader, he was the Chief Technical Analyst for Stockcharts.com and the main contributor to the ChartSchool.
PRINT THIS ARTICLE
SYMMETRICAL TRIANGLE
When Seemingly Good Patterns Go Bad
11/21/05 08:51:31 AMby Arthur Hill
With two big moves in as many months, the outlook for the Dow Diamonds went from bear to bull with a classic whipsaw.
Position: Accumulate
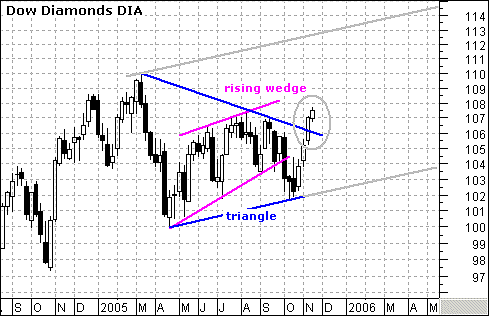
| The Dow Diamonds (DIA) formed a beautiful rising wedge and looked destined to break 100. With that in mind, all was going according to plan with the October trendline break, long black candlestick, and move below the July low. Then the decline abruptly reversed and now, the stock is suddenly trading above its summer highs (Figure 1). What gives? |

|
| FIGURE 1: DIA DIRECTION? The Dow Diamonds looked destined to break 100 -- but there was a sudden reversal and the stock is now trading above its summer highs. What happened? |
| Graphic provided by: MetaStock. |
| Graphic provided by: MS QuoteCenter. |
| |
| Whipsaws and traps are all part of the game in technical analysis and trading. Seemingly valid patterns turn on their heads, and traders should be prepared to switch sides when the unexpected occurs. This is exactly what happened with the Dow Diamonds (DIA). First, the October support break (103.44) failed to hold. This was the first warning that something was wrong. Second, the stock surged over the last four weeks and broke the March trendline. This provided a clear signal that the bulls were back in town. |
| The bearish rising wedge has given way to a bullish symmetrical triangle. The trendline break and higher high confirm this pattern and argue for higher prices. The gray trendline extending up from the March high runs parallel to the lower triangle trendline. This can be used for an upside projection, and it can extend to 114-115 by the end of April 2006. As long as the breakout at 106 holds, there is no reason to question bullish resolve. |
Arthur Hill is currently editor of TDTrader.com, a website specializing in trading strategies, sector/industry specific breadth stats and overall technical analysis. He passed the Society of Technical Analysts (STA London) diploma exam with distinction is a Certified Financial Technician (CFTe). Prior to TD Trader, he was the Chief Technical Analyst for Stockcharts.com and the main contributor to the ChartSchool.
| Title: | Editor |
| Company: | TDTrader.com |
| Address: | Willem Geetsstraat 17 |
| Mechelen, B2800 | |
| Phone # for sales: | 3215345465 |
| Website: | www.tdtrader.com |
| E-mail address: | arthurh@tdtrader.com |
Traders' Resource Links | |
| TDTrader.com has not added any product or service information to TRADERS' RESOURCE. | |
Click here for more information about our publications!
Comments
Date: 11/22/05Rank: 4Comment:

Request Information From Our Sponsors
- StockCharts.com, Inc.
- Candle Patterns
- Candlestick Charting Explained
- Intermarket Technical Analysis
- John Murphy on Chart Analysis
- John Murphy's Chart Pattern Recognition
- John Murphy's Market Message
- MurphyExplainsMarketAnalysis-Intermarket Analysis
- MurphyExplainsMarketAnalysis-Visual Analysis
- StockCharts.com
- Technical Analysis of the Financial Markets
- The Visual Investor
- VectorVest, Inc.
- Executive Premier Workshop
- One-Day Options Course
- OptionsPro
- Retirement Income Workshop
- Sure-Fire Trading Systems (VectorVest, Inc.)
- Trading as a Business Workshop
- VectorVest 7 EOD
- VectorVest 7 RealTime/IntraDay
- VectorVest AutoTester
- VectorVest Educational Services
- VectorVest OnLine
- VectorVest Options Analyzer
- VectorVest ProGraphics v6.0
- VectorVest ProTrader 7
- VectorVest RealTime Derby Tool
- VectorVest Simulator
- VectorVest Variator
- VectorVest Watchdog
