HOT TOPICS LIST
- MACD
- Fibonacci
- RSI
- Gann
- ADXR
- Stochastics
- Volume
- Triangles
- Futures
- Cycles
- Volatility
- ZIGZAG
- MESA
- Retracement
- Aroon
INDICATORS LIST
LIST OF TOPICS
PRINT THIS ARTICLE
by Gary Grosschadl
UK-based Vodafone, the world's largest cell phone service company, dragged the European telecom sector almost 6% lower this week.
Position: Sell
Gary Grosschadl
Independent Canadian equities trader and technical analyst based in Peterborough
Ontario, Canada.
PRINT THIS ARTICLE
DOUBLE TOPS
Vodafone Veers South
11/21/05 07:45:41 AMby Gary Grosschadl
UK-based Vodafone, the world's largest cell phone service company, dragged the European telecom sector almost 6% lower this week.
Position: Sell
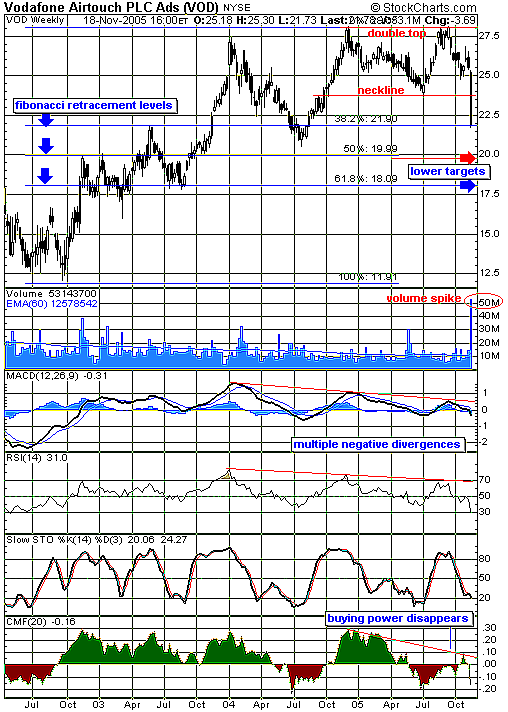
| Vodafone's shares dropped 11% after the company warned its profit margins would narrow. This sharp decline in the company's share price was the steepest one-day drop since September 1998. This gap down on Tuesday, November 15 (from which there has been no recovery thus far), gives the weekly chart of this stock a large black (down) candlestick (Figure 1). |
| The pattern on this chart shows a double top failure. The failure comes with a break of the neckline. In classic style, this is done on abnormally large volume, and this is very much the case here, with weekly volume surging past 50 million shares. The failure target for a double top is equal to the distance between the top and the neckline, applied to the downside move below the neckline. This brings the target to just below $20 at the red arrow. |

|
| FIGURE 1: VOD, WEEKLY. The weekly chart of Vodafone shows a dramatic break below a double top neckline. |
| Graphic provided by: StockCharts.com. |
| |
| To gauge other possible targets, we plot Fibonacci retracement levels. After we mark the low and high of the chart, the software generates the most common Fibonacci targets as roughly one third, one half, and two thirds. Stocks often find support, brief or otherwise, at these levels. As it turns out, the weekly close did reach the first big Fibonacci level at a decline of 38.2%. Should the stock continue to drop, the next levels are roughly $20 and $18. I would anticipate very strong support at the 50% mark, since this is also very close to the double top failure target near $20. |
| For the technical traders, there were some strong signs of trouble ahead as the stock came off its second top. Multiple negative divergences are often a strong signal that all is not well with the recent rise. Here, we see three indicators that clearly illustrate this. The first two indicators below the chart show similar divergences. The moving average convergence/divergence (MACD) and the relative strength index (RSI) both show declining peaks versus the price action, which did not. Even more dramatically, the Chaikin money flow (CMF) indicator showed a severe drying up of buying power at the second peak of the stock's price at $28. This supply/demand indicator hints that "smart money" was not buying that second peak. |
Independent Canadian equities trader and technical analyst based in Peterborough
Ontario, Canada.
| Website: | www.whatsonsale.ca/financial.html |
| E-mail address: | gwg7@sympatico.ca |
Click here for more information about our publications!
Comments
Date: 11/21/05Rank: 5Comment:
Date: 11/26/05Rank: 5Comment:

Request Information From Our Sponsors
- StockCharts.com, Inc.
- Candle Patterns
- Candlestick Charting Explained
- Intermarket Technical Analysis
- John Murphy on Chart Analysis
- John Murphy's Chart Pattern Recognition
- John Murphy's Market Message
- MurphyExplainsMarketAnalysis-Intermarket Analysis
- MurphyExplainsMarketAnalysis-Visual Analysis
- StockCharts.com
- Technical Analysis of the Financial Markets
- The Visual Investor
- VectorVest, Inc.
- Executive Premier Workshop
- One-Day Options Course
- OptionsPro
- Retirement Income Workshop
- Sure-Fire Trading Systems (VectorVest, Inc.)
- Trading as a Business Workshop
- VectorVest 7 EOD
- VectorVest 7 RealTime/IntraDay
- VectorVest AutoTester
- VectorVest Educational Services
- VectorVest OnLine
- VectorVest Options Analyzer
- VectorVest ProGraphics v6.0
- VectorVest ProTrader 7
- VectorVest RealTime Derby Tool
- VectorVest Simulator
- VectorVest Variator
- VectorVest Watchdog
