HOT TOPICS LIST
- MACD
- Fibonacci
- RSI
- Gann
- ADXR
- Stochastics
- Volume
- Triangles
- Futures
- Cycles
- Volatility
- ZIGZAG
- MESA
- Retracement
- Aroon
INDICATORS LIST
LIST OF TOPICS
PRINT THIS ARTICLE
by Koos van der Merwe
Novavax is a specialty biopharmaceutical company engaged in the research, development, and commercialization of proprietary products focused on drug delivery and biological technologies -- in this season of flu, a share to watch.
Position: Accumulate
Koos van der Merwe
Has been a technical analyst since 1969, and has worked as a futures and options trader with First Financial Futures in Johannesburg, South Africa.
PRINT THIS ARTICLE
ELLIOTT WAVE
Novavax , Birds, And Influenza
11/17/05 01:06:48 PMby Koos van der Merwe
Novavax is a specialty biopharmaceutical company engaged in the research, development, and commercialization of proprietary products focused on drug delivery and biological technologies -- in this season of flu, a share to watch.
Position: Accumulate
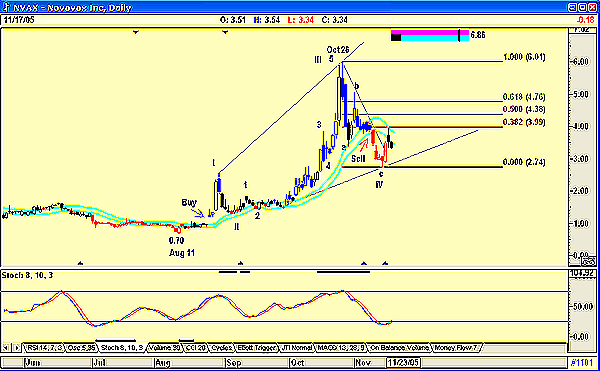
| Novavax's research is focused on developing its technology platforms in drug delivery and on developing its virus like particle (VLP) technology into vaccines for the prevention of infectious diseases such as HIV/AIDS, pandemic flu, seasonal flu, and SARS. With the world concerned about a possible bird flu epidemic, Novavax is one company that could develop a vaccine to ease the spreading fears of a pandemic. Figure 1 is a daily chart of NVAX, which shows how the stock price moved from a low of $0.70 on August 11, 2005, to a high of $6.01 by October 26. This rise correlated with the first signs of bird flu in Asia as speculation grew that the company could produce an effective vaccine. We have only to remember that last winter, the US ran out of flu vaccine. Is the chart then one of pure speculation, or is there substance to the rumor? What does the chart suggest? |

|
| FIGURE 1: NOVAVAX. Here's an Elliott wave count. |
| Graphic provided by: AdvancedGET. |
| |
| Figure 1 suggests a wave count showing that the share could have completed a wave 4 down, with a wave 5 up to follow. The stochastic indicator also suggests this possibility. Should this be a true count, then we could see the price rise to the $6.86 level as determined by the make or break (MOB) target. The MOB study is a proprietary tool of Advanced GET, and suggests a target price area for the end of an Elliott wave 5. I have also shown Fibonacci retracement levels on the chart, which could act as resistance points should the price retrace. |
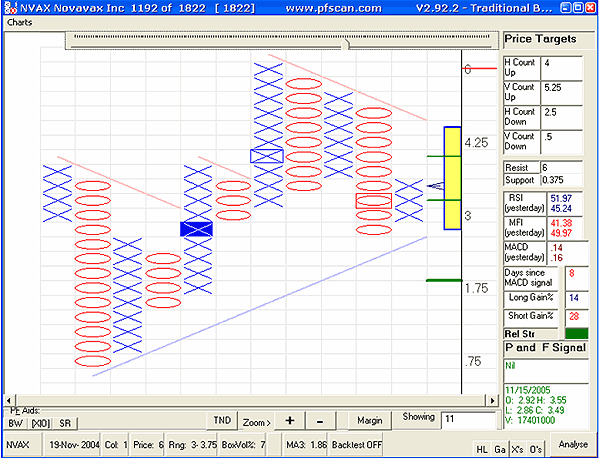
| Do note the buy and sell signals as the price broke the upper and lower JM internal band lines, respectively. The JM internal band in this chart is a 15-period simple moving average offset by 5% positive and 5% negative. Note how the price recently touched the upper band, but did not break through to give a buy signal. Figure 2 is a point & figure chart that suggests that the price target determined by a horizontal count is $4. Of course, this would only be true should the X column rise above the O column, giving a buy signal. |

|
| FIGURE 2: THE HORIZONTAL COUNT. Here's a point & figure chart showing possible targets for this stock. |
| Graphic provided by: PFScan. |
| |
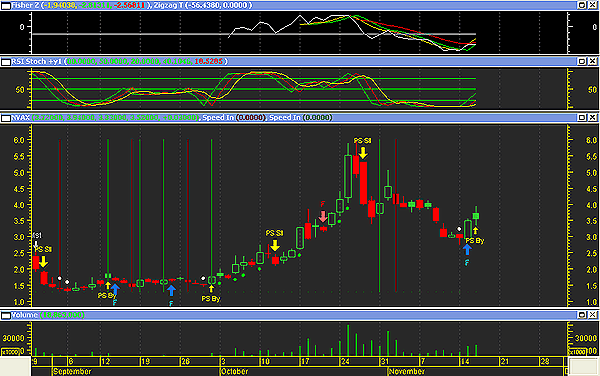
| Finally, when I look at Figure 3, a daily chart using the stochastic RSI and Fisher transform indicators, I am also receiving a buy signal. |

|
| FIGURE 3: STOCHASTIC RSI AND FISHER TRANSFORM. Here's a daily chart of Novavax showing buy and sell signals. |
| Graphic provided by: MetaStock. |
| |
| Is the buy signal given by the various indicators for Novavax pure speculation, or is there truly substance to the buying activity of the company's shares? I have searched the Internet to substantiate the rumors, but have found nothing concrete. Bulletin boards are talking about the collaboration with various companies to develop a vaccine that will be available sometime in the future, but not available should there be a major pandemic NOW. A share worth watching. |
Has been a technical analyst since 1969, and has worked as a futures and options trader with First Financial Futures in Johannesburg, South Africa.
| Address: | 3256 West 24th Ave |
| Vancouver, BC | |
| Phone # for sales: | 6042634214 |
| E-mail address: | petroosp@gmail.com |
Click here for more information about our publications!
Comments
Date: 11/17/05Rank: 3Comment:

Request Information From Our Sponsors
- VectorVest, Inc.
- Executive Premier Workshop
- One-Day Options Course
- OptionsPro
- Retirement Income Workshop
- Sure-Fire Trading Systems (VectorVest, Inc.)
- Trading as a Business Workshop
- VectorVest 7 EOD
- VectorVest 7 RealTime/IntraDay
- VectorVest AutoTester
- VectorVest Educational Services
- VectorVest OnLine
- VectorVest Options Analyzer
- VectorVest ProGraphics v6.0
- VectorVest ProTrader 7
- VectorVest RealTime Derby Tool
- VectorVest Simulator
- VectorVest Variator
- VectorVest Watchdog
- StockCharts.com, Inc.
- Candle Patterns
- Candlestick Charting Explained
- Intermarket Technical Analysis
- John Murphy on Chart Analysis
- John Murphy's Chart Pattern Recognition
- John Murphy's Market Message
- MurphyExplainsMarketAnalysis-Intermarket Analysis
- MurphyExplainsMarketAnalysis-Visual Analysis
- StockCharts.com
- Technical Analysis of the Financial Markets
- The Visual Investor
