HOT TOPICS LIST
- MACD
- Fibonacci
- RSI
- Gann
- ADXR
- Stochastics
- Volume
- Triangles
- Futures
- Cycles
- Volatility
- ZIGZAG
- MESA
- Retracement
- Aroon
INDICATORS LIST
LIST OF TOPICS
PRINT THIS ARTICLE
by Gary Grosschadl
Dell faltered in the autumn and is now showing early signs of a possible reversal.
Position: Accumulate
Gary Grosschadl
Independent Canadian equities trader and technical analyst based in Peterborough
Ontario, Canada.
PRINT THIS ARTICLE
REVERSAL
Are Dell's Dark Days Done?
11/17/05 10:32:50 AMby Gary Grosschadl
Dell faltered in the autumn and is now showing early signs of a possible reversal.
Position: Accumulate
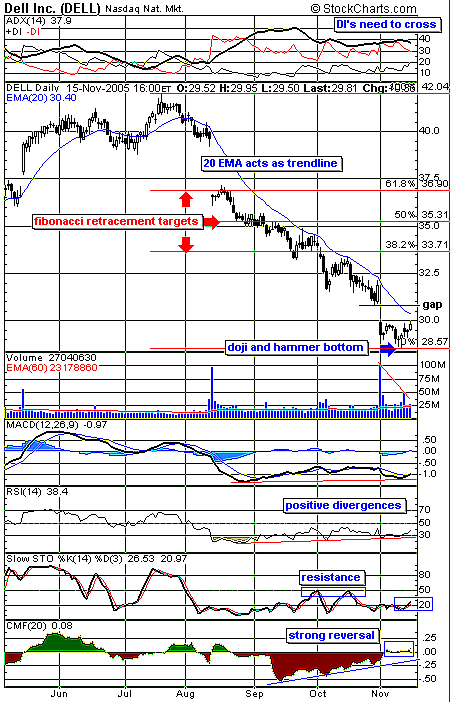
| Dell fell 34% off its summertime highs. Those traders who sold their positions when the stock weakened below its 20-day exponential moving average (EMA) were well served. By the same measure, those potential buyers (aside from daytraders) who held off buying while the stock stayed under this telling moving average did well to avoid this falling knife. Now it may be time to take a closer look. |
| There are several early signs that the bottom may be in. Two candlesticks marking a recent low are noteworthy. A doji (small cross), followed by a bottom hammer, both hint at a possible bottom (Figure 1). Dojis after a large upleg or downleg often signal an important shift in momentum. In this case, the bears could not move the stock lower, so bulls become encouraged. The bottom hammer with its long lower shadow or tail also shows that bears weakened as the bulls closed the session nears the highs of that period. |

|
| FIGURE 1: DELL DAILY DOWNLEG. Dell's substantial downleg may be over, according to some early signs on this daily chart. |
| Graphic provided by: StockCharts.com. |
| |
| Several indicators are also encouraging. The moving average convergence/divergence (MACD) and the relative strength indicator (RSI) both show a positive divergence to price action. This often hints at a coming upleg. The question is, how far can it go? The uppermost indicator reflects extended bearish period via the directional indicators (DIs). With -DI above +DI, the bears or bearish power prevails. For a substantial shift in momentum to take place, these DIs need to cross-reflect bullish power taking the upper hand. The most compelling indicator, however, is the one at the very bottom. The Chaikin money flow (CMF) indicator shows a dramatic shift to finally edge into slightly positive territory. This hints that selling power has finally abated and some bulls are entering the ring. |
| If there is an upleg, what will be the targets? The first hurdle is that previously mentioned line in the sand -- overhead resistance offered by the 20-period EMA, closely followed by gap resistance just under $31. For a significant move to occur, the stock price would have to close above this area. This could set up a potential move to challenge the three most common Fibonacci retracement targets between 33.70 and 36.90. First things first, however. The stock must close above gap resistance and then use its 20-period EMA as a support level. |
Independent Canadian equities trader and technical analyst based in Peterborough
Ontario, Canada.
| Website: | www.whatsonsale.ca/financial.html |
| E-mail address: | gwg7@sympatico.ca |
Click here for more information about our publications!
PRINT THIS ARTICLE

Request Information From Our Sponsors
- StockCharts.com, Inc.
- Candle Patterns
- Candlestick Charting Explained
- Intermarket Technical Analysis
- John Murphy on Chart Analysis
- John Murphy's Chart Pattern Recognition
- John Murphy's Market Message
- MurphyExplainsMarketAnalysis-Intermarket Analysis
- MurphyExplainsMarketAnalysis-Visual Analysis
- StockCharts.com
- Technical Analysis of the Financial Markets
- The Visual Investor
- VectorVest, Inc.
- Executive Premier Workshop
- One-Day Options Course
- OptionsPro
- Retirement Income Workshop
- Sure-Fire Trading Systems (VectorVest, Inc.)
- Trading as a Business Workshop
- VectorVest 7 EOD
- VectorVest 7 RealTime/IntraDay
- VectorVest AutoTester
- VectorVest Educational Services
- VectorVest OnLine
- VectorVest Options Analyzer
- VectorVest ProGraphics v6.0
- VectorVest ProTrader 7
- VectorVest RealTime Derby Tool
- VectorVest Simulator
- VectorVest Variator
- VectorVest Watchdog
