HOT TOPICS LIST
- MACD
- Fibonacci
- RSI
- Gann
- ADXR
- Stochastics
- Volume
- Triangles
- Futures
- Cycles
- Volatility
- ZIGZAG
- MESA
- Retracement
- Aroon
INDICATORS LIST
LIST OF TOPICS
PRINT THIS ARTICLE
by David Penn
You can't catch a reversal much faster than you can by correctly anticipating a bull trap.
Position: N/A
David Penn
Technical Writer for Technical Analysis of STOCKS & COMMODITIES magazine, Working-Money.com, and Traders.com Advantage.
PRINT THIS ARTICLE
REVERSAL
A 2B Top In The Industrials?
11/16/05 11:35:18 AMby David Penn
You can't catch a reversal much faster than you can by correctly anticipating a bull trap.
Position: N/A
| One of the fun things about subscribing to a top-quality trading newsletter is that often the calls the newsletter writer makes won't make any sense when incorporated into your own research or technicals. For example, I had two little birdies in each ear this week suggesting that the market was ripe for a reversal on the short to intermediate time frame. One little birdie is known for his uncanny ability to catch turning points in markets, while the other is a master of volume analysis and the way volume can clue traders into reversal opportunities. |
| Try as I could, none of the technical methods I use could replicate their short to intermediate bearish calls. If anything, one of my methods was actually providing a buy target just above the market -- a target that was hit in intraday trading, no less. Well, today that "replication" arrived in the form of a 2B top. Writing in his book Methods Of A Wall Street Master, trader Vic Sperandeo says of the 2B methodology: One negative when trading by (the 1-2-3 criterion) is that by the time all three conditions are met, you sometimes miss a large portion of a price movement. There are other observations, however, that can aid you in deciding to take a position much earlier. One of them, and my personal favorite, is what I call the "2B" criterion. |

|
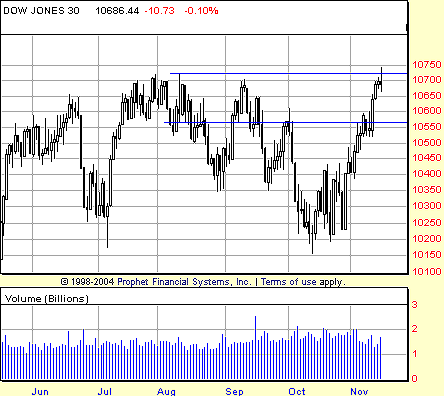
| FIGURE 1: DOW JONES INDUSTRIAL AVERAGE, DAILY. A test of the August highs in mid-November looks likely to fail unless the bulls are able to follow through to the upside in subsequent sessions. |
| Graphic provided by: Prophet Financial, Inc. |
| |
| I've written often enough about the 2B test. This same setup goes by other names as well, such as Larry Connors' "Turtle Soup" and "Turtle Soup Plus One." But all variations of this theme work from the same premise, one expressed succinctly by trader, author, and trading educator Oliver Velez Jr. when he opined that "pros sell new highs while amateurs buy them." And whether it is due to the ability to trigger stops just beyond new highs and new lows, or the notion that weak hands will panic at the slightest show of resistance or support at major psychological barriers, the fact remains that the bull and bear traps that make up 2B tests and Turtle Soup setups are alive and well in the markets. |
| To briefly recap, the 2B test of top occurs when a new high is made, yet there is no follow-through to the upside afterward. In fact, what happens then is that the market reverses -- generally on higher volume than accompanied the new high. Traders trading this setup look to short at the level of the low of the initial high. In the present case, we have a high in August that is exceeded by a new high in November (Figure 1). The fact that the new high took the form of a doji -- a candlestick pattern with intraday (or intrasession) extremes, but a small "real body" -- is also worth noting. Doji patterns tend to reflect indecisiveness in the market. In the context of a market that has been moving higher, the appearance of "indecisiveness" is perhaps reason for pause among those who have already profited from the advance. |

|
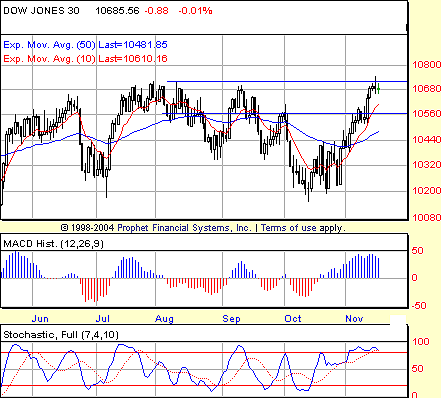
| FIGURE 2: DJIA CORRECTION? By a hair, negative divergences in both the MACD histogram and the stochastic suggest the possibility of a correction. The lower of the two horizontal blue lines indicates the point at which a 2B top reversal would be confirmed. |
| Graphic provided by: Prophet Financial, Inc. |
| |
| In addition to the potentially bearish implications of the doji, the moving average convergence/divergence (MACD) histogram and stochastic are providing cautionary notes of their own (Figure 2). Although you might need to increase the magnification on your spyglass to see it, both indicators are displaying negative divergences (at least as of Wednesday morning) as the $INDU moved to new highs in mid-November. The fact that higher highs in price are being matched by lower highs in key indicators like the MACD histogram and the stochastic clearly suggests exhaustion on the part of the buyers, and an increased likelihood that sellers will be able drive the market lower. |
Technical Writer for Technical Analysis of STOCKS & COMMODITIES magazine, Working-Money.com, and Traders.com Advantage.
| Title: | Technical Writer |
| Company: | Technical Analysis, Inc. |
| Address: | 4757 California Avenue SW |
| Seattle, WA 98116 | |
| Phone # for sales: | 206 938 0570 |
| Fax: | 206 938 1307 |
| Website: | www.Traders.com |
| E-mail address: | DPenn@traders.com |
Traders' Resource Links | |
| Charting the Stock Market: The Wyckoff Method -- Books | |
| Working-Money.com -- Online Trading Services | |
| Traders.com Advantage -- Online Trading Services | |
| Technical Analysis of Stocks & Commodities -- Publications and Newsletters | |
| Working Money, at Working-Money.com -- Publications and Newsletters | |
| Traders.com Advantage -- Publications and Newsletters | |
| Professional Traders Starter Kit -- Software | |
Click here for more information about our publications!
Comments
Date: 11/16/05Rank: 3Comment:
Date: 11/17/05Rank: 3Comment:
Date: 11/23/05Rank: 5Comment:

Request Information From Our Sponsors
- StockCharts.com, Inc.
- Candle Patterns
- Candlestick Charting Explained
- Intermarket Technical Analysis
- John Murphy on Chart Analysis
- John Murphy's Chart Pattern Recognition
- John Murphy's Market Message
- MurphyExplainsMarketAnalysis-Intermarket Analysis
- MurphyExplainsMarketAnalysis-Visual Analysis
- StockCharts.com
- Technical Analysis of the Financial Markets
- The Visual Investor
- VectorVest, Inc.
- Executive Premier Workshop
- One-Day Options Course
- OptionsPro
- Retirement Income Workshop
- Sure-Fire Trading Systems (VectorVest, Inc.)
- Trading as a Business Workshop
- VectorVest 7 EOD
- VectorVest 7 RealTime/IntraDay
- VectorVest AutoTester
- VectorVest Educational Services
- VectorVest OnLine
- VectorVest Options Analyzer
- VectorVest ProGraphics v6.0
- VectorVest ProTrader 7
- VectorVest RealTime Derby Tool
- VectorVest Simulator
- VectorVest Variator
- VectorVest Watchdog
