HOT TOPICS LIST
- MACD
- Fibonacci
- RSI
- Gann
- ADXR
- Stochastics
- Volume
- Triangles
- Futures
- Cycles
- Volatility
- ZIGZAG
- MESA
- Retracement
- Aroon
INDICATORS LIST
LIST OF TOPICS
PRINT THIS ARTICLE
by David Penn
Has the rotation arrived for smokestack stocks?
Position: N/A
David Penn
Technical Writer for Technical Analysis of STOCKS & COMMODITIES magazine, Working-Money.com, and Traders.com Advantage.
PRINT THIS ARTICLE
SECTOR INVESTING
Smoke Rising?
11/16/05 08:06:23 AMby David Penn
Has the rotation arrived for smokestack stocks?
Position: N/A
| If you mostly follow the main indexes -- the Dow Jones Industrial Average, the NASDAQ, the Russell 200 and Standard & Poor's 500 -- there are two ways your primary focus can help you find those sectors that are most eagerly participated in any given rally. The first approach is commonsensical. If your analysis suggests that the markets as a whole are nearing a significant low, then it can be a good idea to go sector scanning by way of exchange-traded funds or HOLDRS to see if any sector is also nearing what appears to be a significant low. Sometimes, you'll find a sector that has already made its low and has begun moving up in advance of the rest of the market. This would be an example of a sector that is providing (or, in some cases, trying to provide) leadership for the rest of the market. The other approach is also far from mysterious, even though it is applicable later in the advance. With this approach, the trick is to find those sectors that have not participated in the rally; many may have even been in a bear market while the rest of the market was moving higher. Check to see if these sectors tend to move either contracyclically to those sectors that have been rallying or if these sectors tend to occur at a different stage in the economic cycle. |
| For those who aren't familiar with the business cycle as it relates to sector rotation, here is a general outline from Sam Stovall's book Standard & Poor's Guide To Sector Investing. The sectors listed for each phase of the business cycle are those that tend to outperform during that phase: Early expansion Transportation Technology Middle expansion Services Capital goods Late expansion Basic materials Energy Early contraction Consumer staples Utilities Financials Consumer cyclicals Late contraction None |
| It is worth remembering that this is truly a cycle. So some aggressive investors will look to bid up technology stocks, for example, late in an economic contraction. As technology stocks start to fade, some investors and speculators will begin to explore bargain opportunities in the materials and energy sectors -- sectors that tend to do well with the inflation that accompanies economic expansion, especially in its late stages. I'm not making the argument that technology is starting to fade. But I am wondering if the cyclical bull market that began in April 2005 is getting a little gray around the temples; might this current business cycle similarly be getting long in the tooth? If so, then one of the places toward which investors should be putting their attention is in the capital goods/basic materials group of stocks, a group also affectionately referred to as the smokestack stocks. |

|
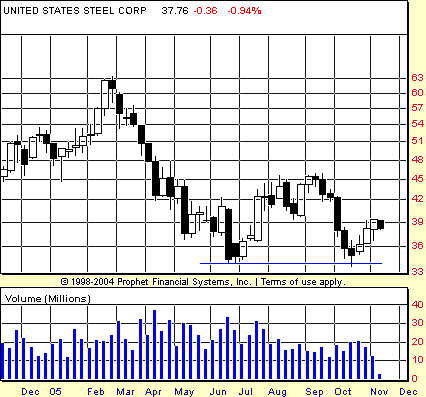
| FIGURE 1: US STEEL, WEEKLY. A 2B test of bottom appears in this weekly chart of US Steel. A double bottom breakout would take the stock even higher, should shares of X close above the $45 level. The entry for the weekly 2B test of bottom was just north of $36. |
| Graphic provided by: Prophet Financial, Inc. |
| |
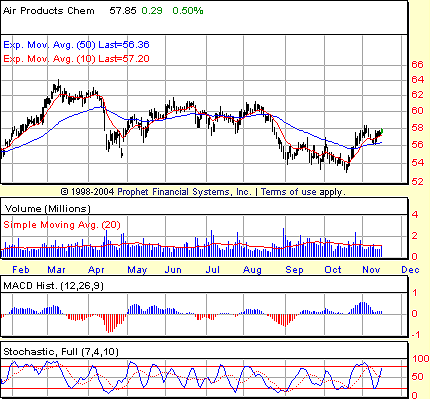
| Examples of the sort of stocks I'm thinking about include classic American companies like US Steel (Figure 1) and DuPont, as well as lesser-known names such as Air Products and Chemicals (Figure 2), PPG Industries, and Bemis Co. |

|
| FIGURE 2: AIR PRODUCTS & CHEMICALS, DAILY. A bullish moving average convergence/divergence histogram spike in late October/early November and a positive stochastic divergence from late August to mid-October help build the case for a bounce higher in APD. |
| Graphic provided by: Prophet Financial, Inc. |
| |
| Jim Cramer of MSNBC's Mad Money recently reminded listeners of his radio show, "Real Money With Jim Cramer," that if "you pick the right sector, you are liable to make money." Cramer calls it the most important kind of analysis you can do, and others, citing a study from Investor's Business Daily, have suggested that as much as 70% of a stock's move is related to its sector. With those kinds of accolades, it isn't hard to understand why so many market professionals pay as much attention to the sector rotation as baseball managers pay to the pitching rotation. |
Technical Writer for Technical Analysis of STOCKS & COMMODITIES magazine, Working-Money.com, and Traders.com Advantage.
| Title: | Technical Writer |
| Company: | Technical Analysis, Inc. |
| Address: | 4757 California Avenue SW |
| Seattle, WA 98116 | |
| Phone # for sales: | 206 938 0570 |
| Fax: | 206 938 1307 |
| Website: | www.Traders.com |
| E-mail address: | DPenn@traders.com |
Traders' Resource Links | |
| Charting the Stock Market: The Wyckoff Method -- Books | |
| Working-Money.com -- Online Trading Services | |
| Traders.com Advantage -- Online Trading Services | |
| Technical Analysis of Stocks & Commodities -- Publications and Newsletters | |
| Working Money, at Working-Money.com -- Publications and Newsletters | |
| Traders.com Advantage -- Publications and Newsletters | |
| Professional Traders Starter Kit -- Software | |
Click here for more information about our publications!
Comments
Date: 11/16/05Rank: 4Comment:
Date: 11/16/05Rank: 4Comment:

Request Information From Our Sponsors
- StockCharts.com, Inc.
- Candle Patterns
- Candlestick Charting Explained
- Intermarket Technical Analysis
- John Murphy on Chart Analysis
- John Murphy's Chart Pattern Recognition
- John Murphy's Market Message
- MurphyExplainsMarketAnalysis-Intermarket Analysis
- MurphyExplainsMarketAnalysis-Visual Analysis
- StockCharts.com
- Technical Analysis of the Financial Markets
- The Visual Investor
- VectorVest, Inc.
- Executive Premier Workshop
- One-Day Options Course
- OptionsPro
- Retirement Income Workshop
- Sure-Fire Trading Systems (VectorVest, Inc.)
- Trading as a Business Workshop
- VectorVest 7 EOD
- VectorVest 7 RealTime/IntraDay
- VectorVest AutoTester
- VectorVest Educational Services
- VectorVest OnLine
- VectorVest Options Analyzer
- VectorVest ProGraphics v6.0
- VectorVest ProTrader 7
- VectorVest RealTime Derby Tool
- VectorVest Simulator
- VectorVest Variator
- VectorVest Watchdog
