HOT TOPICS LIST
- MACD
- Fibonacci
- RSI
- Gann
- ADXR
- Stochastics
- Volume
- Triangles
- Futures
- Cycles
- Volatility
- ZIGZAG
- MESA
- Retracement
- Aroon
INDICATORS LIST
LIST OF TOPICS
PRINT THIS ARTICLE
by David Penn
A month testing the upper boundary of its trend channel is followed by a month testing the lower boundary.
Position: N/A
David Penn
Technical Writer for Technical Analysis of STOCKS & COMMODITIES magazine, Working-Money.com, and Traders.com Advantage.
PRINT THIS ARTICLE
TREND-CHANNEL
$HUI's Golden Channel
11/15/05 07:52:27 AMby David Penn
A month testing the upper boundary of its trend channel is followed by a month testing the lower boundary.
Position: N/A
| I've written quite a bit about trend channels for Traders.com Advantage and Working-Money.com. In some ways, they are just glorified trendlines with the added benefit of letting traders know when prices are reaching an extreme deviation from the trend. We see these extreme deviations in breakouts from price congestion, from Bollinger Bands, in volatility indicators. And there is an argument that what seems extreme-in-the-present eventually charts the future course forward. |
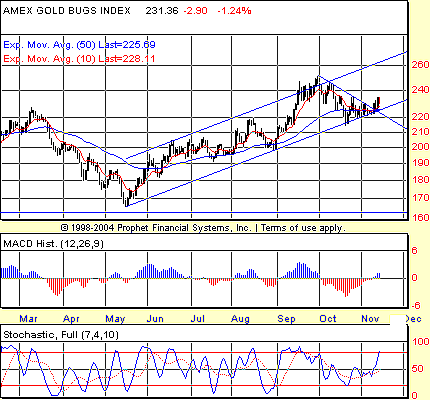
| Or back. In the second half of September, the index of unhedged gold mining stocks broke out above a trend channel that had contained its price action since the mid-May 2005 bottom. This breakout was potentially a major development. Sometimes, prices break out above the upper boundary of a trend channel and then turn that upper boundary from a region of resistance to one of support. |

|
| FIGURE 1: DAILY AMEX GOLD BUGS INDEX ($HUI). The deep MACD histogram trough in October -- after months of rallying prices -- warns of an increased risk of lower prices going forward. |
| Graphic provided by: Prophet Financial, Inc. |
| |
| This pattern of finding support on the back of an upper trend channel boundary that once provided resistance is something we've seen before. We saw this pattern in the US Dollar Index with the early summer breakout and the early autumn support. Though the dollar did dip back into the body of the channel in mid-summer, the positive divergences in both the moving average convergence/divergence (MACD) histogram and stochastic during that dip actually reinforced the idea that the trend was strong and headed higher. So what does it mean that gold, rather than rally above its trend channel and remain there (or largely there), has not only moved back into the body of the trend channel, but is now testing the lower boundary (see Figure 1)? |
| I should point out that the $HUI is more or less resting on the back of its 10- and 50-day exponential moving averages (EMAs). This, in addition to the support likely to be provided by the lower boundary of the trend channel, is reason enough for bears not to get too giddy at the prospect of betting against the gold stocks. That said, any break below the lower boundary of the trend channel would face the same sort of test that any breakout from the upper boundary would. Will prices remain outside the channel, or will they migrate back inside the channel? And if they do migrate back inside the channel, will they hug the lower boundary -- generally a warning of weakness -- or will they move back up to test the upper boundary? |
| So far, so good for the gold bulls. Moving toward mid-November, the $HUI broke out against a short-term, month-long downtrend that began at the end of September. Its immediate task, however, is to move toward the other side of the trend channel and, perhaps, to even break out above and beyond it again. |
Technical Writer for Technical Analysis of STOCKS & COMMODITIES magazine, Working-Money.com, and Traders.com Advantage.
| Title: | Technical Writer |
| Company: | Technical Analysis, Inc. |
| Address: | 4757 California Avenue SW |
| Seattle, WA 98116 | |
| Phone # for sales: | 206 938 0570 |
| Fax: | 206 938 1307 |
| Website: | www.Traders.com |
| E-mail address: | DPenn@traders.com |
Traders' Resource Links | |
| Charting the Stock Market: The Wyckoff Method -- Books | |
| Working-Money.com -- Online Trading Services | |
| Traders.com Advantage -- Online Trading Services | |
| Technical Analysis of Stocks & Commodities -- Publications and Newsletters | |
| Working Money, at Working-Money.com -- Publications and Newsletters | |
| Traders.com Advantage -- Publications and Newsletters | |
| Professional Traders Starter Kit -- Software | |
Click here for more information about our publications!
Comments
Date: 11/15/05Rank: 4Comment:
Date: 11/16/05Rank: 5Comment:

Request Information From Our Sponsors
- StockCharts.com, Inc.
- Candle Patterns
- Candlestick Charting Explained
- Intermarket Technical Analysis
- John Murphy on Chart Analysis
- John Murphy's Chart Pattern Recognition
- John Murphy's Market Message
- MurphyExplainsMarketAnalysis-Intermarket Analysis
- MurphyExplainsMarketAnalysis-Visual Analysis
- StockCharts.com
- Technical Analysis of the Financial Markets
- The Visual Investor
- VectorVest, Inc.
- Executive Premier Workshop
- One-Day Options Course
- OptionsPro
- Retirement Income Workshop
- Sure-Fire Trading Systems (VectorVest, Inc.)
- Trading as a Business Workshop
- VectorVest 7 EOD
- VectorVest 7 RealTime/IntraDay
- VectorVest AutoTester
- VectorVest Educational Services
- VectorVest OnLine
- VectorVest Options Analyzer
- VectorVest ProGraphics v6.0
- VectorVest ProTrader 7
- VectorVest RealTime Derby Tool
- VectorVest Simulator
- VectorVest Variator
- VectorVest Watchdog
