HOT TOPICS LIST
- MACD
- Fibonacci
- RSI
- Gann
- ADXR
- Stochastics
- Volume
- Triangles
- Futures
- Cycles
- Volatility
- ZIGZAG
- MESA
- Retracement
- Aroon
INDICATORS LIST
LIST OF TOPICS
PRINT THIS ARTICLE
by Paolo Pezzutti
The media giant displayed a positive divergence of the Bollinger indicator %b and developed a reversal formation.
Position: N/A
Paolo Pezzutti
Author of the book "Trading the US Markets - A Comprehensive Guide to US Markets for International Traders and Investors" - Harriman House (July 2008)
PRINT THIS ARTICLE
REVERSAL
News Corp. Shows A Short-Term Reversal Formation
11/14/05 07:49:49 AMby Paolo Pezzutti
The media giant displayed a positive divergence of the Bollinger indicator %b and developed a reversal formation.
Position: N/A
| Rupert Murdoch's entertainment and media giant News Corp. (NWS) announced that it had lost $433 million, or 13 cents a share, in its first fiscal quarter. In the year-ago period, it posted a profit of $625 million, or 21 cents a share. The company took a $1 billion charge related to a change in the way the licenses of its television stations are valued. Excluding the charge, it would have earned $580 million, or 18 cents a share, in the latest period. |

|
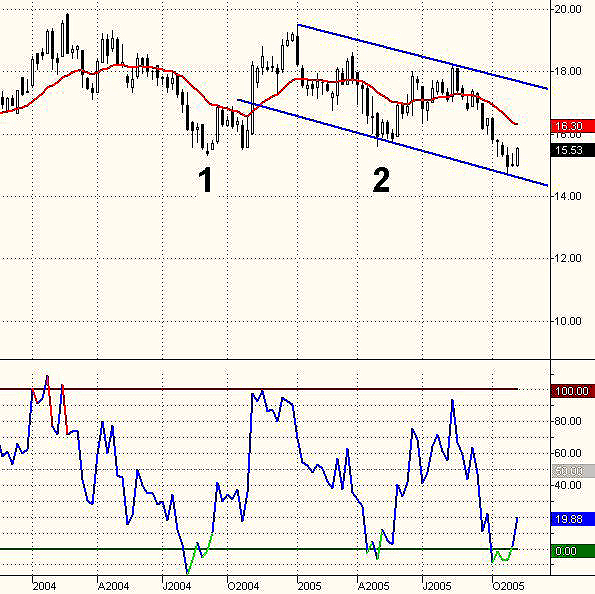
| FIGURE 1: NEWS CORP. WEEKLY. The NWS weekly chart printed a harami candlestick pattern. The %b (close) indicator turned up, exiting from oversold. |
| Graphic provided by: TradeStation. |
| |
| The news had a positive impact on investors during the last trading session of the week, with the stock gaining 1.90% at 15.53 after a deep correction during the past three months. Technically speaking, in the weekly chart seen in Figure 1, you can see that the stock during the past year has traded between the $19 and $15 levels. In this time frame, the stock displayed weakness. Note, in fact, the lower highs printed during the period considered. Since last year, prices have been moving within a negatively inclined channel. They are now testing the lower trendline. The indicator %b (close), which can be used to tell us where we are within the Bollinger Bands (%b=(last close-Upper Band)/(Upper Band-Lower Band), spotted well the September 2004 (point 1) and April 2005 (point 2) lows. Last week, %b(close) turned up after being oversold and gave a buy signal. The weeks of October 28 and November 4 displayed a candlestick harami pattern, which occurs when a small real body is contained within a prior relatively long real body. "Harami" is an old Japanese term for "pregnant." The long candlestick is "the mother" candlestick and the small candlestick is the "baby." It is a reversal pattern, although not so strong as, for example, the morning star. |

|
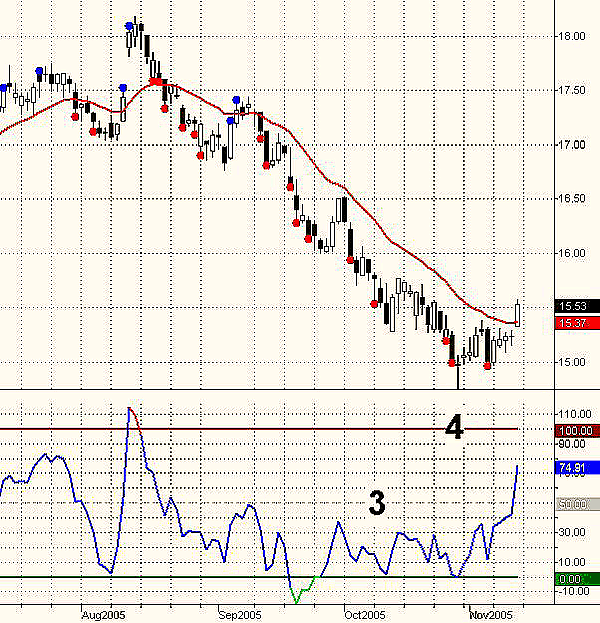
| FIGURE 2: RUN DAYS. During the three-month movement, the downtrend was confirmed by clusters of run days. |
| Graphic provided by: TradeStation. |
| |
| The daily chart in Figure 2 shows how the stock lost about 3 points since the top on August 12, 2005. I have highlighted the run days. It is a one-day pattern described by Jack Schwager in his book Schwager On Futures: Technical Analysis. An up run day occurs when: - The true high is greater than the maximum true high of the past n days. - The true low is lower the minimum true low of the subsequent n days. The opposite rule is valid for down run days. In Figure 2, I used n=3. The run day represents a trending day. Markets typically alternate between trends and congestions. The move to new areas of balance is fast and usually short. These short runs are where you will find the run day pattern to show the ongoing trend. |
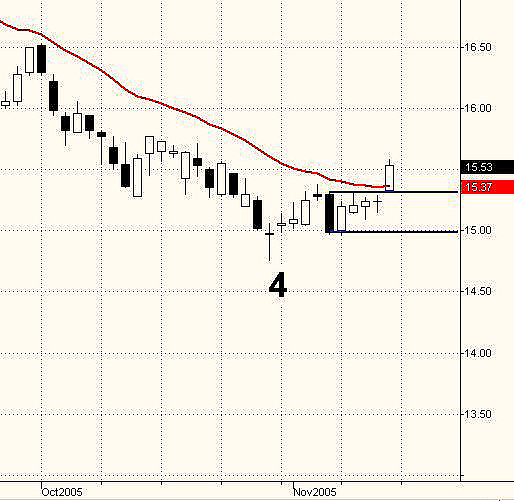
| Note that during the last three-month downtrend, you had a number of run days, indicating a strong trend to the downside. The indicator %b (close) printed a continued positive divergence since October (point 3). Divergences are difficult to trade and you cannot base your entry signals exclusively on them. However, they can be a useful tool to assess potential conditions for a reversal. A very interesting doji star marked the October 28th low (point 4). During the following two weeks, a sideways market developed (Figure 3). The indicator moved to the upside while volatility contracted. The past four sessions printed a series of inside days with respect to the black measuring candle of November 4. The last one is a small range doji. A breakout of the high/low of the measuring candle is the entry level for the setup. Given the positive divergence of the indicator %b(close), a buy setup was preferable. After the news on Friday, November 11, the stock opened higher in a breakout mode, expanding its range in a trend day. This reversal formation could bring in the short-term prices higher to a first resistance level in the $16 area. |

|
| FIGURE 3: BREAKOUT. The last trading session displayed a breakout to the upside of a five-day congestion. |
| Graphic provided by: TradeStation. |
| |
| The intermediate trend is negative. The current action at the daily level might only represent a rebound. But prices are at their support and there are elements for at least a short-term continuation of the move. |
Author of the book "Trading the US Markets - A Comprehensive Guide to US Markets for International Traders and Investors" - Harriman House (July 2008)
| Address: | VIA ROBERTO AGO 26 POSTAL CODE 00166 |
| Rome, ITALY | |
| Phone # for sales: | +393357540708 |
| E-mail address: | pezzutti.paolo@tiscali.it |
Click here for more information about our publications!
Comments
Date: 11/14/05Rank: 3Comment:
Date: 11/15/05Rank: 4Comment:

Request Information From Our Sponsors
- StockCharts.com, Inc.
- Candle Patterns
- Candlestick Charting Explained
- Intermarket Technical Analysis
- John Murphy on Chart Analysis
- John Murphy's Chart Pattern Recognition
- John Murphy's Market Message
- MurphyExplainsMarketAnalysis-Intermarket Analysis
- MurphyExplainsMarketAnalysis-Visual Analysis
- StockCharts.com
- Technical Analysis of the Financial Markets
- The Visual Investor
- VectorVest, Inc.
- Executive Premier Workshop
- One-Day Options Course
- OptionsPro
- Retirement Income Workshop
- Sure-Fire Trading Systems (VectorVest, Inc.)
- Trading as a Business Workshop
- VectorVest 7 EOD
- VectorVest 7 RealTime/IntraDay
- VectorVest AutoTester
- VectorVest Educational Services
- VectorVest OnLine
- VectorVest Options Analyzer
- VectorVest ProGraphics v6.0
- VectorVest ProTrader 7
- VectorVest RealTime Derby Tool
- VectorVest Simulator
- VectorVest Variator
- VectorVest Watchdog
