HOT TOPICS LIST
- MACD
- Fibonacci
- RSI
- Gann
- ADXR
- Stochastics
- Volume
- Triangles
- Futures
- Cycles
- Volatility
- ZIGZAG
- MESA
- Retracement
- Aroon
INDICATORS LIST
LIST OF TOPICS
PRINT THIS ARTICLE
by David Penn
The "chopped liver" bull market from the late 2002 lows reaches a major milepost in late 2005.
Position: N/A
David Penn
Technical Writer for Technical Analysis of STOCKS & COMMODITIES magazine, Working-Money.com, and Traders.com Advantage.
PRINT THIS ARTICLE
BULL/BEAR MARKET
The NASDAQ's Pre-September 11th Mindset
11/11/05 03:20:52 PMby David Penn
The "chopped liver" bull market from the late 2002 lows reaches a major milepost in late 2005.
Position: N/A
| During the 2004 Presidential campaign, George W. Bush frequently referred to the dangers of living in a September 10th or "pre-September 11th mindset." Most observers thought W. was taking a shot at challenger John Kerry and the Democrats. But a little over a year since the President's reelection victory, it becomes all the more clear that if there is a "pre-September 11th mindset" to be found, the place to look isn't in the Democratic Party, it's in the NASDAQ. |

|
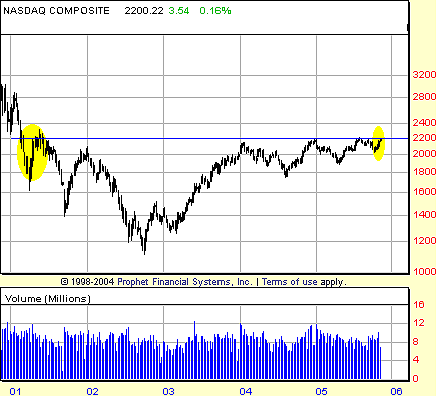
| FIGURE 1: WEEKLY NASDAQ. In November 2005, the NASDAQ made its highest weekly close since June 2001. |
| Graphic provided by: Prophet Financial, Inc. |
| |
| I call this the "chopped liver" bull market, after the classic refrain of the overlooked and underappreciated, "What am I, chopped liver?" Why? Because while this market has often confused and frustrated investors and traders alike, the NASDAQ since the autumn of 2002 has been a committed bull market participant. Even as some observers of the financial markets insist that the "real" bull market is just around the corner--or, in the case of at least one talented technical analyst, already newly upon us--it is as if the move from under 1200 in the autumn of 2002 to over 2200 in the autumn of 2005 was merely an appetizer, a little something to tide over growling investor stomachs until the real meal arrived. If so, then that's some hors d'oeuvre! That's an 83% gain in three years! |
| What's been all the more impressive about this bull market has been that even in its trading range over the past two years, the NASDAQ has continued to display bull market characteristics. Chief among them has been the continued pattern of higher highs and higher lows. The January weekly high close in 2004 was exceeded by the December weekly high close in 2004, and that level has been exceeded by the November weekly high close in 2005. The troughs in between these highs have also been higher and higher. The low point of the summer correction in 2004 in the NASDAQ was roughly 1760. The low point of the spring correction in 2005 was a few points below 1920. The low point of the autumn correction in 2005 was about 2025. On a weekly chart, it is hard to get much more bullish than that (Figure 1). |

|
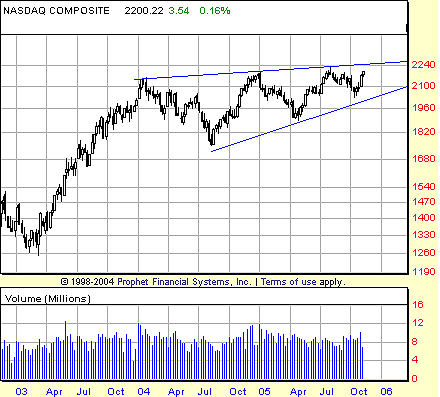
| FIGURE 2: HIGHER HIGHS AND HIGHER LOWS. With higher highs and higher lows, the NASDAQ continues to power higher. But is the price pattern more reminiscent of a bullish ascending triangle or a bearish rising wedge? |
| Graphic provided by: Prophet Financial, Inc. |
| |
| The most intriguing technical development in the weekly NASDAQ chart is the possibility of a breakout above these levels -- a breakout with appropriately powerful volume. Granting the market its consolidation over the past two years (as opposed to insisting as I do that the series of higher highs and higher lows makes for a particularly bullish consolidation) suggests the possibility of a move to 2550 (Figure 2). |

|
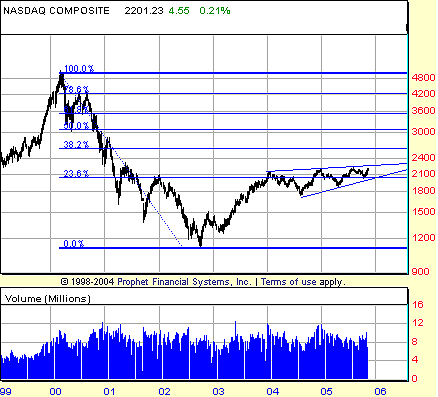
| FIGURE 3: BREAKOUT. Should NASDAQ break out from its bullish consolidation of 2004-05, then a minimum move could take it close to a 38.2% retracement of the bear market from 2000 to 2002. |
| Graphic provided by: Prophet Financial, Inc. |
| |
| How so? Treat the 2004-05 consolidation as a upwardly slanted ascending triangle, or even as a cup with (two) handles (Figure 3). With a breakout level at 2150 (roughly speaking) and a pattern low at about 1750, there are potentially 400 points worth of upside that could take the NASDAQ close to a 38.2% retracement of its entire bear market from the 2000 top. |
Technical Writer for Technical Analysis of STOCKS & COMMODITIES magazine, Working-Money.com, and Traders.com Advantage.
| Title: | Technical Writer |
| Company: | Technical Analysis, Inc. |
| Address: | 4757 California Avenue SW |
| Seattle, WA 98116 | |
| Phone # for sales: | 206 938 0570 |
| Fax: | 206 938 1307 |
| Website: | www.Traders.com |
| E-mail address: | DPenn@traders.com |
Traders' Resource Links | |
| Charting the Stock Market: The Wyckoff Method -- Books | |
| Working-Money.com -- Online Trading Services | |
| Traders.com Advantage -- Online Trading Services | |
| Technical Analysis of Stocks & Commodities -- Publications and Newsletters | |
| Working Money, at Working-Money.com -- Publications and Newsletters | |
| Traders.com Advantage -- Publications and Newsletters | |
| Professional Traders Starter Kit -- Software | |
Click here for more information about our publications!
Comments
Date: 11/12/05Rank: 4Comment:
Date: 11/14/05Rank: 5Comment:
Date: 11/22/05Rank: 5Comment:

Request Information From Our Sponsors
- StockCharts.com, Inc.
- Candle Patterns
- Candlestick Charting Explained
- Intermarket Technical Analysis
- John Murphy on Chart Analysis
- John Murphy's Chart Pattern Recognition
- John Murphy's Market Message
- MurphyExplainsMarketAnalysis-Intermarket Analysis
- MurphyExplainsMarketAnalysis-Visual Analysis
- StockCharts.com
- Technical Analysis of the Financial Markets
- The Visual Investor
- VectorVest, Inc.
- Executive Premier Workshop
- One-Day Options Course
- OptionsPro
- Retirement Income Workshop
- Sure-Fire Trading Systems (VectorVest, Inc.)
- Trading as a Business Workshop
- VectorVest 7 EOD
- VectorVest 7 RealTime/IntraDay
- VectorVest AutoTester
- VectorVest Educational Services
- VectorVest OnLine
- VectorVest Options Analyzer
- VectorVest ProGraphics v6.0
- VectorVest ProTrader 7
- VectorVest RealTime Derby Tool
- VectorVest Simulator
- VectorVest Variator
- VectorVest Watchdog
