HOT TOPICS LIST
- MACD
- Fibonacci
- RSI
- Gann
- ADXR
- Stochastics
- Volume
- Triangles
- Futures
- Cycles
- Volatility
- ZIGZAG
- MESA
- Retracement
- Aroon
INDICATORS LIST
LIST OF TOPICS
PRINT THIS ARTICLE
by Koos van der Merwe
Last week, analyst after analyst interviewed on Canadian television was bullish on gold for the long term. Why, then, am I long-term bearish?
Position: Accumulate
Koos van der Merwe
Has been a technical analyst since 1969, and has worked as a futures and options trader with First Financial Futures in Johannesburg, South Africa.
PRINT THIS ARTICLE
TECHNICAL ANALYSIS
Looking At Gold
11/11/05 09:35:19 AMby Koos van der Merwe
Last week, analyst after analyst interviewed on Canadian television was bullish on gold for the long term. Why, then, am I long-term bearish?
Position: Accumulate
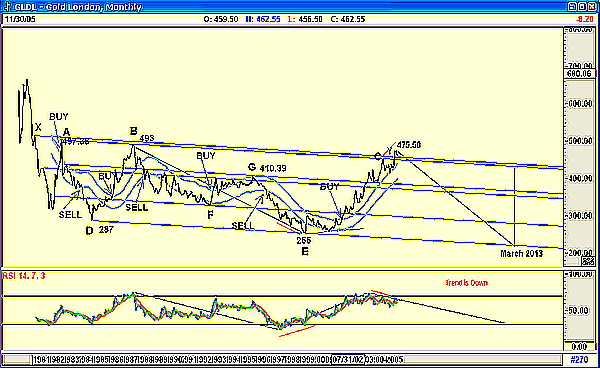
| Figure 1 is a monthly chart of the London gold price from 1981. I have taken the base support line, D-E, and drawn parallel lines from each pivot point, F, G, A , and X. Note the following: a. Both parallels F and G have acted as support lines when gold broke through them in the bull run, E to C, and the corrected top found support before the next rise. However, the gold price should have found resistance on the A-B line and it did so at C, but it broke above it and also broke above the X-Y parallel. As shown, it appears to be looking for support on the X-Y line. b. What is disturbing is the relative strength index (RSI), which has given a divergence sell signal -- that is, where the gold price is making higher highs, but the indicator is making lower highs. The question is whether the support line X-Y will hold, or will gold break below it and also break below the A-B support line and find support at the G parallel. A cyclical forecast from the lows of D and E is suggesting a downtrend for gold until March 2013. |

|
| FIGURE 1: GOLD, MONTHLY. Both parallels F and G have acted as support lines when gold broke through them in the bull run. |
| Graphic provided by: AdvancedGET. |
| |
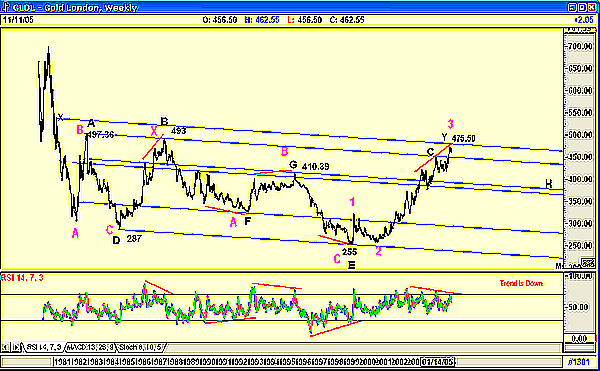
| What does a weekly chart tell us (Figure 2)? It shows that gold did not find the trendline X-Y a resistance level, but in fact corrected before it hit the X-Y resistance. What is disturbing is the historical effectiveness of the divergence on the RSI. This is suggesting that the trend could be down, although gold rising to test the resistance line X-Y at 475.50 should not be ruled out. I also tried to show an Elliott wave count in FUCHSIA. The count is suggesting that gold could have completed a wave 3 up, and is now moving into a wave 4 down, possibly finding support on the G-H support line at the $390 to $400 level before continuing higher. |

|
| FIGURE 2: GOLD, WEEKLY. This shows that gold did not find the trendline X-Y to be a resistance level, but in fact corrected before it hit it. |
| Graphic provided by: AdvancedGET. |
| |
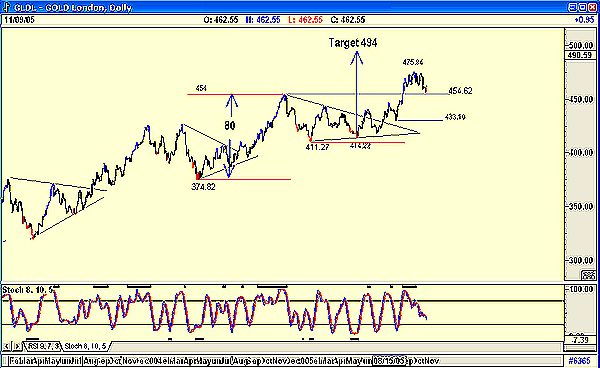
| Looking at a daily chart (Figure 3), you can see how the gold price has been rising in a series of consolidation triangles. The most recent one is suggesting a target of $494. (Move into the triangle from $374 to $454 = $80 added to $414 = $494.) The gold price rose as high as $475.84 before falling to test the $454 pivot point. For this chart, I have used a stochastic indicator, 8-10-5, which is still negative, suggesting further downside before a move up. To conclude, although the monthly chart has broken above a major resistance level, its indicator is suggesting that the major trend is down. However, a divergence could once again occur with the gold price making new highs, while the RSI shows lower highs. The weekly chart, on the hand, is suggesting that the medium-term trend is down, possibly to the $390 to $400 level, a sizable drop from the current price. Finally, the daily chart also suggests weakness, but not to the levels suggested by Figure 2. There is support at $454 and at $433, should the $454 support be breached. |

|
| FIGURE 3: GOLD, DAILY. You can see how gold has been rising in a series of consolidation triangles. |
| Graphic provided by: AdvancedGET. |
| |
Has been a technical analyst since 1969, and has worked as a futures and options trader with First Financial Futures in Johannesburg, South Africa.
| Address: | 3256 West 24th Ave |
| Vancouver, BC | |
| Phone # for sales: | 6042634214 |
| E-mail address: | petroosp@gmail.com |
Click here for more information about our publications!
Comments
Date: 11/12/05Rank: 3Comment:
Date: 11/14/05Rank: 5Comment:
Date: 11/17/05Rank: 4Comment:
Date: 11/22/05Rank: 5Comment:
Date: 12/04/05Rank: Comment: WHO CAN WE KNOW WHEN WE CAME TO SHORT POSITION? WHO CAN WE BELIEVE TO CU TOUR LONG POSITION .SOME ONE TELL TO ME GOLD WILL TOUCH AT425/440/475 ?ITS POSSIBLE?CAN WE C WHICH ANGLE CAME BEFORE BULLISH /BEARSH? CAN U HELP ME?

Request Information From Our Sponsors
- StockCharts.com, Inc.
- Candle Patterns
- Candlestick Charting Explained
- Intermarket Technical Analysis
- John Murphy on Chart Analysis
- John Murphy's Chart Pattern Recognition
- John Murphy's Market Message
- MurphyExplainsMarketAnalysis-Intermarket Analysis
- MurphyExplainsMarketAnalysis-Visual Analysis
- StockCharts.com
- Technical Analysis of the Financial Markets
- The Visual Investor
- VectorVest, Inc.
- Executive Premier Workshop
- One-Day Options Course
- OptionsPro
- Retirement Income Workshop
- Sure-Fire Trading Systems (VectorVest, Inc.)
- Trading as a Business Workshop
- VectorVest 7 EOD
- VectorVest 7 RealTime/IntraDay
- VectorVest AutoTester
- VectorVest Educational Services
- VectorVest OnLine
- VectorVest Options Analyzer
- VectorVest ProGraphics v6.0
- VectorVest ProTrader 7
- VectorVest RealTime Derby Tool
- VectorVest Simulator
- VectorVest Variator
- VectorVest Watchdog
