

HOT TOPICS LIST
- MACD
- Fibonacci
- RSI
- Gann
- ADXR
- Stochastics
- Volume
- Triangles
- Futures
- Cycles
- Volatility
- ZIGZAG
- MESA
- Retracement
- Aroon
INDICATORS LIST
LIST OF TOPICS
PRINT THIS ARTICLE
by Paolo Pezzutti
Strategies based on price patterns are an alternative to complex formulas.
Position: N/A
Paolo Pezzutti
Author of the book "Trading the US Markets - A Comprehensive Guide to US Markets for International Traders and Investors" - Harriman House (July 2008)
PRINT THIS ARTICLE
TECHNICAL INDICATORS
Short-Term Pattern: GAP2H
11/09/05 12:11:21 PMby Paolo Pezzutti
Strategies based on price patterns are an alternative to complex formulas.
Position: N/A
| Many software programs allow you to design, test, and execute trading strategies. Indicators and technical analysis tools offer individual traders the ability to perform research and analysis previously possible only by financial institutions. However, it is not always necessary to implement complex strategies to be profitable. Sometimes, simple trading methods can provide excellent results. They can have value and result in trading approaches easy to implement and execute. Michael Harris, in his book Stock Trading Techniques Based On Price Patterns (2001), proposes an approach based on easily identifiable price patterns. One of the patterns that Harris makes available to the public is the GAP2H, a short-term bar pattern strategy. For buys, it indicates a price gap followed by two higher highs. It is a continuation pattern and profits from the fact that momentum to the upside, for example, is supposed to continue after a gap that is not closed in the next two days. Buy the next day at the open if: -Yesterday's low is higher than the high of two days ago -Today's low is greater than yesterday's low -Today's low is lower than yesterday's high -Today's high is greater than yesterday's high. The opposite is true for short trades. |
| The methodology proposed has an exit strategy based on a 7% profit target and a 7% stop-loss. But these values should be adapted to the different asset/market characteristics. Although the strategy goes long and short, it does not reverse. The strategy must go flat before it can take a new position. If you scan your database with end-of-day data, you will see that the pattern is not very common. Possible modifications you might want to apply are related to including a reverse strategy and adapting the exit rules to your trading style. I believe that, as this is a short-term pattern, the exit rule should be based on a trailing stop to lock in profits in a fast-moving market. In addition, I think the stop-loss should be applied when the up gap is closed. The methodology is not mechanical and you can adapt it to your own needs. It provides a valid concept that you can reuse. Let's see the pattern in action. |
|
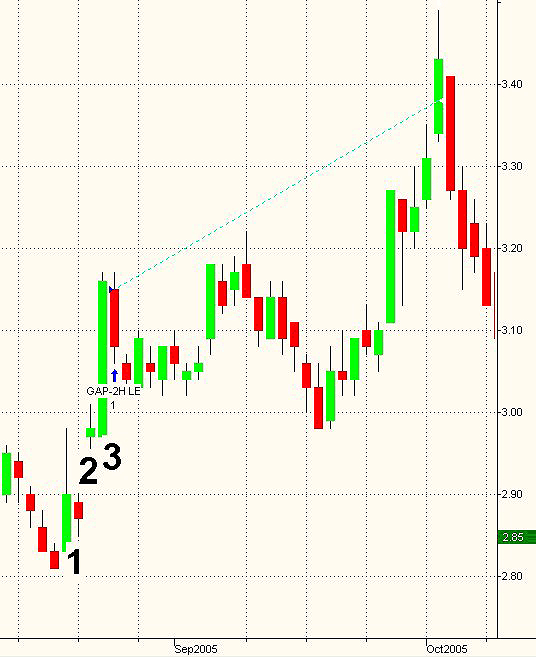
| FIGURE 1: LU, DAILY. The Lucent daily chart displays the GAP2H pattern. It is a continuation pattern triggered after a gap and two higher highs. |
| Graphic provided by: TradeStation. |
| |
| In Figure 1, you can see the Lucent daily chart (LU). The pattern starts on day 1. The next day, you have a gap up (day 2). On day 3 (today), you have a higher high and higher low. The next bar (tomorrow), you buy at the open. In Figure 1, I have applied a 7% profit target methodology. After the entry, prices first did not manage to move to higher equilibrium levels. Then the stock tested its support represented by the low of the buy setup wide-ranging bar (point 3) before starting a fast move to the upside. In this case, the pattern has been successful, but it took several days to hit the target -- not exactly a short-term trade. You would have been in the trade for 28 trading sessions. I'd rather follow an exit approach looking for quick profits right after the entry with no more than five days in the market. But that is up to you and your trading style. |
| The price pattern illustrates the value of a simple trading method. It should be applied to liquid markets. Careful analysis should always precede the actual application, because price patterns good for trading everything with a high probability of success do not exist. This work is hard to do by hand. Software is available on the market that helps traders find and track patterns in the securities databases. What I have shown is an example you can develop for your research, based on your ideas and findings. |
Author of the book "Trading the US Markets - A Comprehensive Guide to US Markets for International Traders and Investors" - Harriman House (July 2008)
| Address: | VIA ROBERTO AGO 26 POSTAL CODE 00166 |
| Rome, ITALY | |
| Phone # for sales: | +393357540708 |
| E-mail address: | pezzutti.paolo@tiscali.it |
Click here for more information about our publications!
Comments
Date:�11/09/05Rank:�4Comment:�
Date:�11/10/05Rank:�3Comment:�
Date:�11/15/05Rank:�4Comment:�

Request Information From Our Sponsors
- VectorVest, Inc.
- Executive Premier Workshop
- One-Day Options Course
- OptionsPro
- Retirement Income Workshop
- Sure-Fire Trading Systems (VectorVest, Inc.)
- Trading as a Business Workshop
- VectorVest 7 EOD
- VectorVest 7 RealTime/IntraDay
- VectorVest AutoTester
- VectorVest Educational Services
- VectorVest OnLine
- VectorVest Options Analyzer
- VectorVest ProGraphics v6.0
- VectorVest ProTrader 7
- VectorVest RealTime Derby Tool
- VectorVest Simulator
- VectorVest Variator
- VectorVest Watchdog
- StockCharts.com, Inc.
- Candle Patterns
- Candlestick Charting Explained
- Intermarket Technical Analysis
- John Murphy on Chart Analysis
- John Murphy's Chart Pattern Recognition
- John Murphy's Market Message
- MurphyExplainsMarketAnalysis-Intermarket Analysis
- MurphyExplainsMarketAnalysis-Visual Analysis
- StockCharts.com
- Technical Analysis of the Financial Markets
- The Visual Investor