HOT TOPICS LIST
- MACD
- Fibonacci
- RSI
- Gann
- ADXR
- Stochastics
- Volume
- Triangles
- Futures
- Cycles
- Volatility
- ZIGZAG
- MESA
- Retracement
- Aroon
INDICATORS LIST
LIST OF TOPICS
PRINT THIS ARTICLE
by David Penn
Entry discipline avoided the nonbreakdown and provided an opportunity to join the ride higher.
Position: N/A
David Penn
Technical Writer for Technical Analysis of STOCKS & COMMODITIES magazine, Working-Money.com, and Traders.com Advantage.
PRINT THIS ARTICLE
BREAKOUTS
About That Breakdown: Transports, Take Two
11/08/05 12:49:16 PMby David Penn
Entry discipline avoided the nonbreakdown and provided an opportunity to join the ride higher.
Position: N/A
| Wrapping up my recent post-mortem on the breakdown in the transportation average that didn't happen ("About That Breakdown: Dow Transports Division," Traders.com Advantage; November 7, 2005), I said that in addition to showing how entry rule discipline would have avoided taking a bearish position (as opposed to having merely a bearish stance or outlook) in the transports, I would soon show how similar strategies using the moving average convergence/divergence (MACD) histogram and 50-day exponential moving average (EMA) would have signaled an opportunity to the long side. |
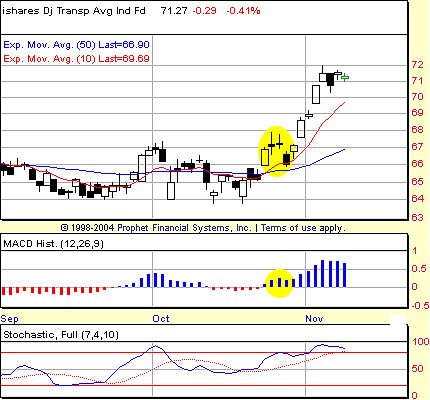
| First, let me point out that it is possible to trade the transports. This opportunity comes courtesy of the exchange-traded fund iShares (IYT). As Figure 1 shows, the same MACD histogram "reversal day" highlighted in the chart of the transportation average is the same October 27th reversal day highlighted in the IYT. In both cases, an entry price would have been created, but there was no follow-through to the downside to turn that entry target into a live position. |

|
| FIGURE 1: DAILY iSHARES TRANSPORTATION ETF: The same short entry opportunity discussed in “About That Breakdown: Dow Transports Division” is shown here in the exchange-traded fund that tracks the transportation average (IYT). As with the transportation average itself, the lack of follow-through to the downside prevented the short signal from becoming a (losing) short position. |
| Graphic provided by: Prophet Financial, Inc. |
| |
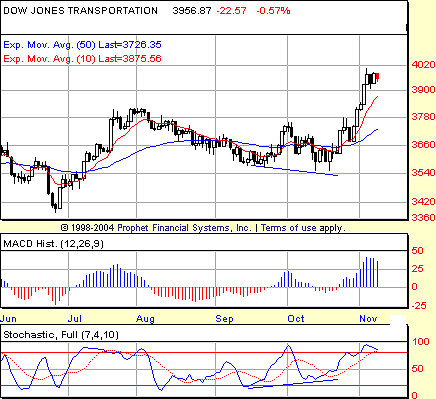
| Having shown how a trader could have avoided taking a short position in the transports -- even as the average looked ripe for rollover--I now want to talk about how a trader could have actually gotten long the transports. I mentioned two factors at the close of the previous article on the nonbreakdown: divergences and the three-bull-closes rule. First, the divergences. It was negative divergence that set up the initial short opportunity. However, as the chart of the transportation average shows perhaps more clearly (Figure 2), there was another, positive, month-to-month divergence that provided aid and comfort to the possibility of the transports moving higher. We can see this positive divergence in Figure 1 -- the stochastic making a higher trough in October compared to September, while prices in October were marginally lower than the lows of September. Again, the chart of the transports -- especially seen over a slightly longer time frame -- makes the positive stochastic divergence all the more plain. |

|
| FIGURE 2: DAILY TRANSPORTATION AVERAGE. The positive stochastic divergence from September to October suggested that if the bears couldn’t take the transports down, the bulls would be more than happy to take them up. |
| Graphic provided by: Prophet Financial, Inc. |
| |
| The entry discipline here provided a number of possible "reversal days." Each time the stochastic "hooked up" in October -- and there are at least four different instances -- there was a new potential upside entry target. The first was on October 11, the second on October 14, the third October 19, and the fourth -- and most obvious on the chart of the averages -- was on October 24. Comparing the chart of the transports to the IYT, the October 24th "reversal day" is less clear -- although the previous three were virtually identical to the ones noted in the average itself. All of these entry targets would have gotten a trader long sometime during the four days between October 24 and 27. |
| I also mentioned the three-bull-closes rule. This was a method I've relied on when prices moved too quickly for a normal pullback that would have created a "reversal day" in the MACD histogram. Along with the MACD histogram crossover, it is a worthwhile tool for those whose use of the histogram occasionally means missing out on certain strong, retracement-free moves in the market. Simply put, if I get three consecutive closes above the 50-day EMA, then I allow myself to treat the third day as if it were a "reversal day" for the purpose of creating an entry target. Recall that I have two ways of creating an entry target with MACD histograms. The first is the next close that takes out the high of the reversal day. The second is to take the reversal day's range, divided it by two, and add that amount to the value at the high of the reversal day. Using the three-bull-closes rule, a trader focusing on the transport average would have treated October 26 as a reversal day and made a long entry on October 31 (next higher close). The "range/2" method also would have secured an October 31st entry, albeit at a somewhat lower price (3800.93 compared to the October 31st close of 3815.46). Both methods would have created profitable positions as of this writing, with the transports trading at 3959.88. |
Technical Writer for Technical Analysis of STOCKS & COMMODITIES magazine, Working-Money.com, and Traders.com Advantage.
| Title: | Technical Writer |
| Company: | Technical Analysis, Inc. |
| Address: | 4757 California Avenue SW |
| Seattle, WA 98116 | |
| Phone # for sales: | 206 938 0570 |
| Fax: | 206 938 1307 |
| Website: | www.Traders.com |
| E-mail address: | DPenn@traders.com |
Traders' Resource Links | |
| Charting the Stock Market: The Wyckoff Method -- Books | |
| Working-Money.com -- Online Trading Services | |
| Traders.com Advantage -- Online Trading Services | |
| Technical Analysis of Stocks & Commodities -- Publications and Newsletters | |
| Working Money, at Working-Money.com -- Publications and Newsletters | |
| Traders.com Advantage -- Publications and Newsletters | |
| Professional Traders Starter Kit -- Software | |
Click here for more information about our publications!
Comments
Date: 11/08/05Rank: 3Comment:
Date: 11/09/05Rank: 5Comment:

Request Information From Our Sponsors
- StockCharts.com, Inc.
- Candle Patterns
- Candlestick Charting Explained
- Intermarket Technical Analysis
- John Murphy on Chart Analysis
- John Murphy's Chart Pattern Recognition
- John Murphy's Market Message
- MurphyExplainsMarketAnalysis-Intermarket Analysis
- MurphyExplainsMarketAnalysis-Visual Analysis
- StockCharts.com
- Technical Analysis of the Financial Markets
- The Visual Investor
- VectorVest, Inc.
- Executive Premier Workshop
- One-Day Options Course
- OptionsPro
- Retirement Income Workshop
- Sure-Fire Trading Systems (VectorVest, Inc.)
- Trading as a Business Workshop
- VectorVest 7 EOD
- VectorVest 7 RealTime/IntraDay
- VectorVest AutoTester
- VectorVest Educational Services
- VectorVest OnLine
- VectorVest Options Analyzer
- VectorVest ProGraphics v6.0
- VectorVest ProTrader 7
- VectorVest RealTime Derby Tool
- VectorVest Simulator
- VectorVest Variator
- VectorVest Watchdog
