HOT TOPICS LIST
- MACD
- Fibonacci
- RSI
- Gann
- ADXR
- Stochastics
- Volume
- Triangles
- Futures
- Cycles
- Volatility
- ZIGZAG
- MESA
- Retracement
- Aroon
INDICATORS LIST
LIST OF TOPICS
PRINT THIS ARTICLE
by David Penn
The transports signaled the possibility of a breakdown in late October, but a retreat from shooting star candlesticks turned into a reversal to the upside.
Position: N/A
David Penn
Technical Writer for Technical Analysis of STOCKS & COMMODITIES magazine, Working-Money.com, and Traders.com Advantage.
PRINT THIS ARTICLE
DOW THEORY
About That Breakdown, Dow Transports Division
11/07/05 02:30:21 PMby David Penn
The transports signaled the possibility of a breakdown in late October, but a retreat from shooting star candlesticks turned into a reversal to the upside.
Position: N/A
| What did I miss? That was the first question I asked myself in the days leading up to Halloween, when the Dow transports -- which looked ripe for a rollover -- instead surged higher. Let's go back to the tape, as they say on Sunday afternoons this time of year. |
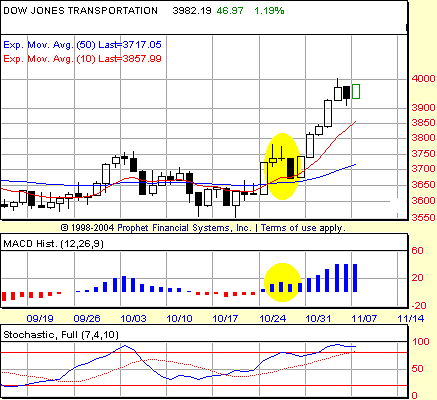
| The case against the transports had a number of pillars. Negative divergences in both the stochastic and the moving average convergence/divergence (MACD) histogram suggested that there was a strong chance that the transports would continue lower. And while not at the top of an extended rally, the shooting star-like candlesticks late in October added a further bearish cast to the market's movement (Figure 1). And certainly, had the transports in fact broken down, all of these pillars would have been considered almost obvious signposts of relative doom. |

|
| FIGURE 1: DAILY DOW JONES TRANSPORTATION AVERAGE. Breaking out above and finding support on its 10- and 50-day exponential moving averages, the DJTA defies the bearishness of negative divergences in both the stochastic and MACD histogram. |
| Graphic provided by: Prophet Financial, Inc. |
| |
| So what happened to the doom? The transports never flipped the switch. Consider how the MACD histogram reacted -- and how prices did and did not react in late October. There were negative divergences in the stochastic and MACD histogram as of October 27. As of the close of that date, the MACDH has made a lower high vis-a-vis the early October MACD histogram high. In addition, the 7,10 stochastic had completed a lower high vis-a-vis the early October stochastic high. The transports were making a higher high, and thus, a negative divergence had been created. |
| How to trade that negative divergence? The approaches I have mentioned in the past both rely on the histogram reversal day. In this case, that day was October 27. On that date, the histogram, which had crossed over to the positive (blue), dipped back down. In the context of a negative divergence, that is sufficient grounds to posit a short entry somewhere below that reversal day (or "session," if you prefer). |
| There are two ways of doing that. The first is simply to wait for the first close below the low of the reversal day, and to use that closing level as the entry level. The second is to take half the range of the reversal day and to subtract that amount from the low of the reversal day. In the first case, we would have looked for a close after October 27 lower than 3675.32. In the second case, we would have had a short entry target bit lower lower at 3643.28. Suffice it to say that there was no short entry from either method. The market opened up the following day and never looked back. So what did I miss? Tune in next time for more on divergences and the three-bull-closes rule. |
Technical Writer for Technical Analysis of STOCKS & COMMODITIES magazine, Working-Money.com, and Traders.com Advantage.
| Title: | Technical Writer |
| Company: | Technical Analysis, Inc. |
| Address: | 4757 California Avenue SW |
| Seattle, WA 98116 | |
| Phone # for sales: | 206 938 0570 |
| Fax: | 206 938 1307 |
| Website: | www.Traders.com |
| E-mail address: | DPenn@traders.com |
Traders' Resource Links | |
| Charting the Stock Market: The Wyckoff Method -- Books | |
| Working-Money.com -- Online Trading Services | |
| Traders.com Advantage -- Online Trading Services | |
| Technical Analysis of Stocks & Commodities -- Publications and Newsletters | |
| Working Money, at Working-Money.com -- Publications and Newsletters | |
| Traders.com Advantage -- Publications and Newsletters | |
| Professional Traders Starter Kit -- Software | |
Click here for more information about our publications!
Comments
Date: 11/07/05Rank: 3Comment:
Date: 11/16/05Rank: 5Comment:

Request Information From Our Sponsors
- StockCharts.com, Inc.
- Candle Patterns
- Candlestick Charting Explained
- Intermarket Technical Analysis
- John Murphy on Chart Analysis
- John Murphy's Chart Pattern Recognition
- John Murphy's Market Message
- MurphyExplainsMarketAnalysis-Intermarket Analysis
- MurphyExplainsMarketAnalysis-Visual Analysis
- StockCharts.com
- Technical Analysis of the Financial Markets
- The Visual Investor
- VectorVest, Inc.
- Executive Premier Workshop
- One-Day Options Course
- OptionsPro
- Retirement Income Workshop
- Sure-Fire Trading Systems (VectorVest, Inc.)
- Trading as a Business Workshop
- VectorVest 7 EOD
- VectorVest 7 RealTime/IntraDay
- VectorVest AutoTester
- VectorVest Educational Services
- VectorVest OnLine
- VectorVest Options Analyzer
- VectorVest ProGraphics v6.0
- VectorVest ProTrader 7
- VectorVest RealTime Derby Tool
- VectorVest Simulator
- VectorVest Variator
- VectorVest Watchdog
