HOT TOPICS LIST
- MACD
- Fibonacci
- RSI
- Gann
- ADXR
- Stochastics
- Volume
- Triangles
- Futures
- Cycles
- Volatility
- ZIGZAG
- MESA
- Retracement
- Aroon
INDICATORS LIST
LIST OF TOPICS
PRINT THIS ARTICLE
by Arthur Hill
The Internet architecture HOLDRS held up quite well in the first half of October, but failed to participate in the market bounce over the last few weeks.
Position: Hold
Arthur Hill
Arthur Hill is currently editor of TDTrader.com, a website specializing in trading strategies, sector/industry specific breadth stats and overall technical analysis. He passed the Society of Technical Analysts (STA London) diploma exam with distinction is a Certified Financial Technician (CFTe). Prior to TD Trader, he was the Chief Technical Analyst for Stockcharts.com and the main contributor to the ChartSchool.
PRINT THIS ARTICLE
RECTANGLES
Internet Architecture Holding Range
11/07/05 02:10:16 PMby Arthur Hill
The Internet architecture HOLDRS held up quite well in the first half of October, but failed to participate in the market bounce over the last few weeks.
Position: Hold
| The Internet architecture HOLDRS (IAH) is sitting on a fence and could fall either way. In the first half of October, IAH demonstrated good relative strength by holding firm in the face of broad weakness. However, the NASDAQ bottomed in mid-October and surged 150 points over the last three to four weeks. Despite such a strong move in the NASDAQ, IAH remained in its trading range and now exhibits relative weakness. |

|
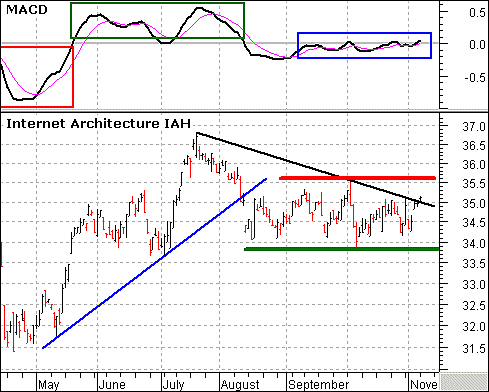
| FIGURE 1: IAH. The stock broke the blue trendline with the August decline and never fully recovered. |
| Graphic provided by: MetaStock. |
| Graphic provided by: MS QuoteCenter. |
| |
| Turning to the price channel (Figure 1), the stock broke the blue trendline with the August decline and never fully recovered. Even though the decline stopped in mid-August, IAH traded flat the last three to four months and the current trading range holds the key. A break above the range high (35.6) would be bullish and a break below the range low (33.8) would be bearish. On a short-term note, also note that the stock gapped higher last Thursday, and follow-through to this gap would be bullish. |
| As expected, the moving average convergence/divergence (MACD) confirms flat momentum and also requires a breakout for the next signal. Momentum was negative in April-May when MACD was below zero (red box). Momentum turned positive in June and July when MACD was above zero (green box). The indicator has since turned flat and traded on either side of zero during the last two months (blue box). Look for a move above the October high to turn momentum bullish or a move below the October low to turn momentum bearish. |
Arthur Hill is currently editor of TDTrader.com, a website specializing in trading strategies, sector/industry specific breadth stats and overall technical analysis. He passed the Society of Technical Analysts (STA London) diploma exam with distinction is a Certified Financial Technician (CFTe). Prior to TD Trader, he was the Chief Technical Analyst for Stockcharts.com and the main contributor to the ChartSchool.
| Title: | Editor |
| Company: | TDTrader.com |
| Address: | Willem Geetsstraat 17 |
| Mechelen, B2800 | |
| Phone # for sales: | 3215345465 |
| Website: | www.tdtrader.com |
| E-mail address: | arthurh@tdtrader.com |
Traders' Resource Links | |
| TDTrader.com has not added any product or service information to TRADERS' RESOURCE. | |
Click here for more information about our publications!
Comments
Date: 11/07/05Rank: 3Comment:
Date: 11/09/05Rank: 3Comment:

Request Information From Our Sponsors
- StockCharts.com, Inc.
- Candle Patterns
- Candlestick Charting Explained
- Intermarket Technical Analysis
- John Murphy on Chart Analysis
- John Murphy's Chart Pattern Recognition
- John Murphy's Market Message
- MurphyExplainsMarketAnalysis-Intermarket Analysis
- MurphyExplainsMarketAnalysis-Visual Analysis
- StockCharts.com
- Technical Analysis of the Financial Markets
- The Visual Investor
- VectorVest, Inc.
- Executive Premier Workshop
- One-Day Options Course
- OptionsPro
- Retirement Income Workshop
- Sure-Fire Trading Systems (VectorVest, Inc.)
- Trading as a Business Workshop
- VectorVest 7 EOD
- VectorVest 7 RealTime/IntraDay
- VectorVest AutoTester
- VectorVest Educational Services
- VectorVest OnLine
- VectorVest Options Analyzer
- VectorVest ProGraphics v6.0
- VectorVest ProTrader 7
- VectorVest RealTime Derby Tool
- VectorVest Simulator
- VectorVest Variator
- VectorVest Watchdog
