HOT TOPICS LIST
- MACD
- Fibonacci
- RSI
- Gann
- ADXR
- Stochastics
- Volume
- Triangles
- Futures
- Cycles
- Volatility
- ZIGZAG
- MESA
- Retracement
- Aroon
INDICATORS LIST
LIST OF TOPICS
PRINT THIS ARTICLE
by David Penn
Support at the 50-week EMA and successive closes above the 10-week EMA point to higher prices in the greenback.
Position: N/A
David Penn
Technical Writer for Technical Analysis of STOCKS & COMMODITIES magazine, Working-Money.com, and Traders.com Advantage.
PRINT THIS ARTICLE
SUPPORT & RESISTANCE
Dancin' With Mr. D(ollar)
11/07/05 01:44:20 PMby David Penn
Support at the 50-week EMA and successive closes above the 10-week EMA point to higher prices in the greenback.
Position: N/A
| "He never smiles, his mouth merely twists The breath in my lungs feels clinging and thick But I know his name, he's called Mr. D. And one of these days he's gonna set you free" --Mick Jagger and Keith Richards, "Dancin' with Mr. D." As far as debtors are concerned, the kind of freedom a bullish dollar might bring is likely to be the kind that is synonymous with "nothing left to lose," to steal from another 1960s-era canto. But the moves in the dollar in recent days have brought the greenback to highs not seen since the summer of 2004. And if new 52-week highs don't loosen the shackles from around the heels of dollar bulls, then I don't know what will. |
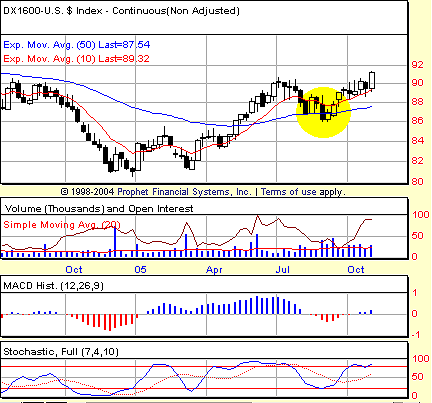
| The cyclical bottom that is noted on the weekly charts of the dollar at the turn of the year has continued (Figure 1). The first important move was the breakout above the 50-week exponential moving average (EMA) in the late spring of 2005. But the second important move was the test of support of that 50-week EMA that occurred in the autumn of 2005. The fact that both the greenback (as measured by continuous futures) and the 10-week EMA found support at the 50-week level was very strong for the dollar, as witnessed by the dollar's breakout in early November. |

|
| FIGURE 1: WEEKLY CONTINUOUS DOLLAR FUTURES. The second key move in the greenback’s rally was the test of support at the 50-week EMA. By November, this third-quarter correction was a classic buying dip. |
| Graphic provided by: Prophet Financial, Inc. |
| |
| As the price action from October 2004 shows, prices can become quite extended from the 10-week EMA. I say that to point out it is quite possible the greenback is still very early in its breakout. Although prices and the 10-week EMA have begun to pull up and away from the longer-term 50-week EMA, prices still appear to be relying on the 10-week EMA for support. Until prices either move dramatically up and away from this moving average (or, of course, plunge beneath it), the path of least resistance remains upward. |

|
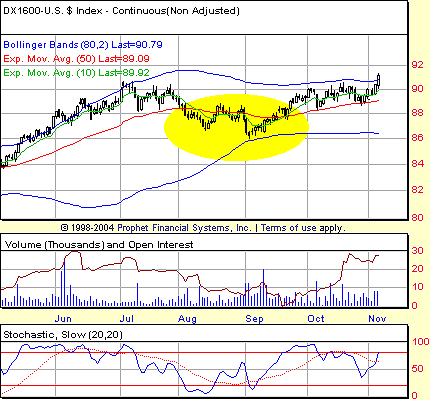
| FIGURE 2: DAILY CONTINUOUS DOLLAR FUTURES. The case for follow-through to the upside in the greenback is buttressed by various technicals on the daily chart. These technicals include the narrowing of the Bollinger Bands over the past few months, which is often a prelude to greater volatility. Support at the 50-day exponential moving average (in red) has also been consistent over the past six weeks. The highlighted area, by the way, shows a positive stochastic divergence on the daily chart that supports the third-quarter buy-the-dip observation from Figure 1. |
| Graphic provided by: Prophet Financial, Inc. |
| |
| As I pointed out in a recent article for Working-Money.com ("BOSO," October 5, 2005), and as numerous traders and technicians have pointed out over the years, bull markets are built on the back of markets that become overbought and remain overbought. There are a lot of ways of gauging an overbought condition, and one of them is penetration of a Bollinger Band to the upside. Though it is true that much of the time prices find the resistance created by an upper Bollinger band to be impenetrable, those occasions when prices do penetrate the upper Bollinger Band often anticipate further moves to the upside (Figure 2). An excellent example of this can be found in the USD/JPY from September to early November. |

|
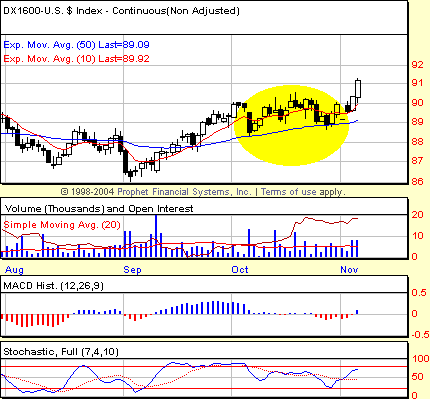
| FIGURE 3: DAILY CONTINUOUS DOLLAR FUTURES. Twice in October, corrections in the greenback found support on the 50-day exponential moving average. The breakout to a new 52-week high in the greenback arrived directly in the wake of the second such test. Note also the surge in volume as prices rally away from the 10-day EMA. |
| Graphic provided by: Prophet Financial, Inc. |
| |
| The same sort of bounce from support that the weekly greenback experienced in the third quarter of 2005 appears to be replaying itself on the daily chart in early November (Figure 3). On two occasions in October, the greenback corrected after making short-term highs, and in both instances, the greenback found support at the 50-day exponential moving average. As the stochastic indicator reveals, this series of corrections has also helped take some of the bullish steam out of the market (the market became less "overbought"). This may help provide the technical "room" for a sustained move higher in the greenback, as suggested also by the Bollinger Band/stochastic breakout. |
Technical Writer for Technical Analysis of STOCKS & COMMODITIES magazine, Working-Money.com, and Traders.com Advantage.
| Title: | Technical Writer |
| Company: | Technical Analysis, Inc. |
| Address: | 4757 California Avenue SW |
| Seattle, WA 98116 | |
| Phone # for sales: | 206 938 0570 |
| Fax: | 206 938 1307 |
| Website: | www.Traders.com |
| E-mail address: | DPenn@traders.com |
Traders' Resource Links | |
| Charting the Stock Market: The Wyckoff Method -- Books | |
| Working-Money.com -- Online Trading Services | |
| Traders.com Advantage -- Online Trading Services | |
| Technical Analysis of Stocks & Commodities -- Publications and Newsletters | |
| Working Money, at Working-Money.com -- Publications and Newsletters | |
| Traders.com Advantage -- Publications and Newsletters | |
| Professional Traders Starter Kit -- Software | |
Click here for more information about our publications!
Comments
Date: 11/07/05Rank: 3Comment:
Date: 11/09/05Rank: 5Comment:
Date: 11/15/05Rank: 4Comment:
Date: 11/17/05Rank: 4Comment:

Request Information From Our Sponsors
- StockCharts.com, Inc.
- Candle Patterns
- Candlestick Charting Explained
- Intermarket Technical Analysis
- John Murphy on Chart Analysis
- John Murphy's Chart Pattern Recognition
- John Murphy's Market Message
- MurphyExplainsMarketAnalysis-Intermarket Analysis
- MurphyExplainsMarketAnalysis-Visual Analysis
- StockCharts.com
- Technical Analysis of the Financial Markets
- The Visual Investor
- VectorVest, Inc.
- Executive Premier Workshop
- One-Day Options Course
- OptionsPro
- Retirement Income Workshop
- Sure-Fire Trading Systems (VectorVest, Inc.)
- Trading as a Business Workshop
- VectorVest 7 EOD
- VectorVest 7 RealTime/IntraDay
- VectorVest AutoTester
- VectorVest Educational Services
- VectorVest OnLine
- VectorVest Options Analyzer
- VectorVest ProGraphics v6.0
- VectorVest ProTrader 7
- VectorVest RealTime Derby Tool
- VectorVest Simulator
- VectorVest Variator
- VectorVest Watchdog
