HOT TOPICS LIST
- MACD
- Fibonacci
- RSI
- Gann
- ADXR
- Stochastics
- Volume
- Triangles
- Futures
- Cycles
- Volatility
- ZIGZAG
- MESA
- Retracement
- Aroon
INDICATORS LIST
LIST OF TOPICS
PRINT THIS ARTICLE
by Paolo Pezzutti
A buy short-term setup brings prices into a first resistance.
Position: N/A
Paolo Pezzutti
Author of the book "Trading the US Markets - A Comprehensive Guide to US Markets for International Traders and Investors" - Harriman House (July 2008)
PRINT THIS ARTICLE
CANDLESTICK CHARTING
PHLX Semiconductor Sector Index
11/04/05 01:31:38 PMby Paolo Pezzutti
A buy short-term setup brings prices into a first resistance.
Position: N/A
| The PHLX Semiconductor Sector Index (SOX) hit its high of 486.34 on August 2, 2005. Since then, prices have started a correction that brought prices to a low of 413 in almost three months. The correction gained speed in the last month when it appeared that an impulse to the downside was ongoing. The move has been very interesting. To analyze it, I used the Bollinger %b indicator and candlestick patterns. The %b is an indicator derived from Bollinger Bands. It measures where the last price is in relation to the bands. The formula to build this indicator is: (LAST-LOWERBAND)/ (UPPERBAND-LOWERBAND). %b can be used to tell us where we are within the bands. %b can assume negative values and values above 100, when prices are outside of the bands. It is a relative tool, with no absolute information. The power of it is that you can calculate it not only on the price (typically the close), but also on other indicators. |

|
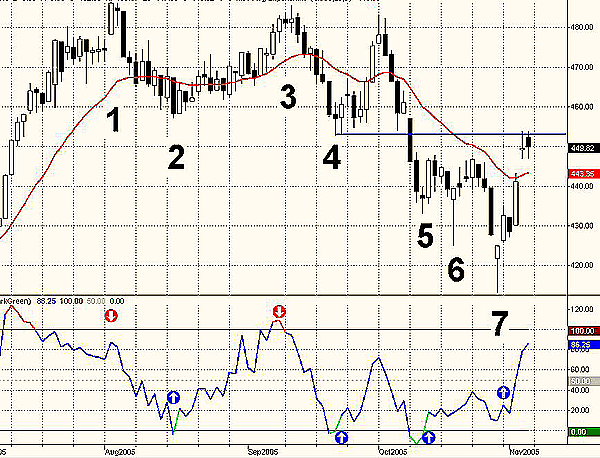
| FIGURE 1: DAILY SOX. The daily chart printed a three-month correction. In October 2, consecutive short-term buy setups (points 5 and 6) failed before finally providing a successful entry signal on point 7. |
| Graphic provided by: TradeStation. |
| |
| During the July 2005 uptrend and at the August 2nd top, the %b signaled a negative divergence (point 1 in Figure 1). In addition, the mid-August low and the September high and low were spotted correctly (points 2, 3, and 4, respectively), with the index moving inside a slightly negatively inclined channel. In Figure 1, point 5 is a morning star candlestick pattern. The signal is formed after a downtrend and identifies a change in investor sentiment. The three-day signal consists of a long black body on the first day. The following day, the star day, gaps down, but the trading range remains small. This results from a day of indecision. The third day is a white candle day, with the bulls in control. That candle should consist of a closing more than halfway up the black candle two days prior. The probability of a morning star signal reversing a trend was assessed high because %b was oversold. The buy setup, however, was a failure. Prices printed a new low, squeezing weak long hands on October 19. The bar (point 6) after a deep low closed the trading day at its high and printed a hammer. The pattern is recognized by the fact that the real body is at the upper end of the trading range, the long lower shadow is more than twice the height of the real body and, finally, it has a very short upper shadow. The bar meant that bears were not in control any more. In addition, %b printed a positive divergence. Was it time for the index to go up? Absolutely not. Another surprise was in the air. After a weak bounce, prices plunged to new lows (point 7)! Another failure. Another squeeze of weak long hands. In addition, this time, prices printed a morning star pattern. Perfect. Two gaps separated the three bars forming the pattern; %b continued to print a positive divergence. The pattern gave an excellent buy signal and prices reacted in a fast environment, moving to the upside to test a first resistance. That may be the right time to exit the trade. |
| The concept of these patterns is that you profit from an exhaustion move. The last sellers bring prices down to extreme levels before strong hands enter the market. As you have seen, however, in this case you have had two perfect setups that ended up in a failure. This is something to be taken into account. Accepting losses is part of the business. A loss has nothing to do with a trader's ability, but with statistics. Not all patterns can be successful. A good trader, however, manages to minimize losses, applying his/her trading tactics with discipline. In this way, you will have small losses, small wins, and sometimes, you will manage to get a real good move and profit. |
Author of the book "Trading the US Markets - A Comprehensive Guide to US Markets for International Traders and Investors" - Harriman House (July 2008)
| Address: | VIA ROBERTO AGO 26 POSTAL CODE 00166 |
| Rome, ITALY | |
| Phone # for sales: | +393357540708 |
| E-mail address: | pezzutti.paolo@tiscali.it |
Click here for more information about our publications!
Comments
Date: 11/04/05Rank: 3Comment:
Date: 11/17/05Rank: 5Comment:

Request Information From Our Sponsors
- VectorVest, Inc.
- Executive Premier Workshop
- One-Day Options Course
- OptionsPro
- Retirement Income Workshop
- Sure-Fire Trading Systems (VectorVest, Inc.)
- Trading as a Business Workshop
- VectorVest 7 EOD
- VectorVest 7 RealTime/IntraDay
- VectorVest AutoTester
- VectorVest Educational Services
- VectorVest OnLine
- VectorVest Options Analyzer
- VectorVest ProGraphics v6.0
- VectorVest ProTrader 7
- VectorVest RealTime Derby Tool
- VectorVest Simulator
- VectorVest Variator
- VectorVest Watchdog
- StockCharts.com, Inc.
- Candle Patterns
- Candlestick Charting Explained
- Intermarket Technical Analysis
- John Murphy on Chart Analysis
- John Murphy's Chart Pattern Recognition
- John Murphy's Market Message
- MurphyExplainsMarketAnalysis-Intermarket Analysis
- MurphyExplainsMarketAnalysis-Visual Analysis
- StockCharts.com
- Technical Analysis of the Financial Markets
- The Visual Investor
