HOT TOPICS LIST
- MACD
- Fibonacci
- RSI
- Gann
- ADXR
- Stochastics
- Volume
- Triangles
- Futures
- Cycles
- Volatility
- ZIGZAG
- MESA
- Retracement
- Aroon
INDICATORS LIST
LIST OF TOPICS
PRINT THIS ARTICLE
by David Penn
Negative divergences in the stochastic and MACDH anticipated an end to the EUR/USD's summer rally.
Position: N/A
David Penn
Technical Writer for Technical Analysis of STOCKS & COMMODITIES magazine, Working-Money.com, and Traders.com Advantage.
PRINT THIS ARTICLE
REVERSAL
The Euro's September Top
11/04/05 11:18:40 AMby David Penn
Negative divergences in the stochastic and MACDH anticipated an end to the EUR/USD's summer rally.
Position: N/A
| In late September, Traders.com Advantage contributor Arthur Hill noted the potential for downside in the euro index ("Euro Index Breaks Flag Support," September 20, 2005). As the EUR/USD plunges toward multimonth lows in early November, I thought it was worth reminding readers that they had been warned of the potential for the euro to, as Hill writes, "[continue] its larger downtrend." |
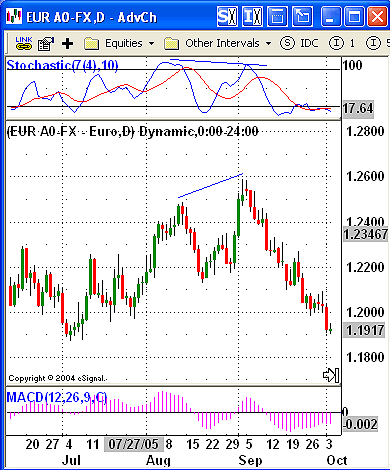
| I also wanted to point out how, using the tools of the 7,10 stochastic and the MACDH, a trader could have come to hold equally bearish views on the euro come summer's end. (See Figure 1.) |

|
| FIGURE 1: EUR/USD. Negative divergences in both the 7,10 stochastic and the MACD histogram anticipated the resumption of the cyclical downtrend in the EUR/USD. |
| Graphic provided by: eSignal. |
| |
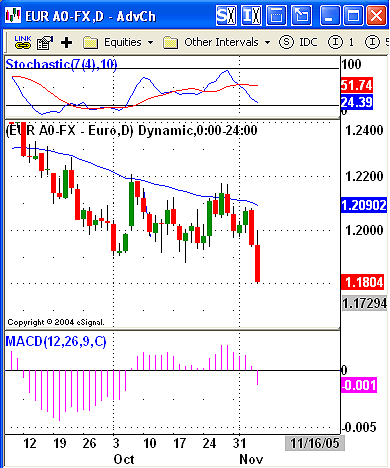
| The line drawing tool wasn't cooperating with my moving average convergence/divergence histogram (MACDH), so I wasn't able to make the notation comparing the histogram peak in August with the histogram peak in early September. But eyeballing the two peaks makes the point plain: as the EUR/USD moved to higher highs in September, the MACDH was making lower highs and creating a clear negative divergence. At the same time, consider the 7,10 stochastic. Once again as the EUR/USD is making higher highs from August to September, the stochastic is making lower highs. Another negative divergence is created. And the fact that both the MACDH and the stochastic developed negative divergences was a definite warning that the upside in the EUR/USD was likely to be limited. The fact that these negative divergences developed -- as Hill pointed out -- in the context of an overall downtrend from the late December 2004 peak is all the more reason for those long the EUR/USD to become cautious. More recently, the EUR/USD's weakness has become more pronounced. The occasion of the latest breakdown was a failed breakout above resistance -- in this case, resistance in the form of the 50-day exponential moving average (EMA). In fact, the rally and reversal on October 27 and 28, respectively, looks very similar to a candlestick pattern called a tweezer top. The tweezer top occurs when the highs of two consecutive candlesticks are identical, suggesting the possibility of a reversal. |
| Against what we see in Figure 2, tweezer tops are best called when they (a) form at the end of an extended uptrend and (b) have exactly the same high. Here, there is no extended uptrend over the course of October leading into the faux tweezer top, and the highs are off by a fraction (1.2173 versus 1.2170). Nevertheless, in an environment such as this, even a faux tweezer top might be worth watching for clues for near-term market action. When we combine the fact of the faux tweezer top with the fact that the two candlesticks represent a breakout above and then a break back down below a significant resistance level (note how the rally in early October stalled at the 50-day EMA), then a case against higher EUR/USD prices in the near term can be made. Add to that the reversal in the MACD histogram, and you have a recipe for a renewed decline. Note how the MACDH is on a rising trend going into late October. But just as prices move down sharply from the faux tweezer top, the MACDH shifts lower instead of continuing higher. Those who have followed my study of the MACDH will know that this represents an opportunity on the downside. |

|
| FIGURE 2: FAUX TWEEZER TOP. A faux tweezer top as the EUR/USD tried to rally above resistance at the 50-day EMA helped set up an opportunity on the downside. |
| Graphic provided by: eSignal. |
| |
| There are two ways of pursuing this opportunity. The first is to simply get short with the first close that is below the low of the "reversal day" -- the "reversal day" being when the MACDH shifted back downward. In this case, that would mean entering on the close of the first day that closes below 1.1968. That day arrived on November 3, with a close of 1.1942. The other entry method -- the one I have referred to more frequently -- calls for taking the range of the reversal day and dividing it in half. That amount is then subtracted from the low of the reversal day to determine an entry target. This method provides for a short entry at 1.1907. |
Technical Writer for Technical Analysis of STOCKS & COMMODITIES magazine, Working-Money.com, and Traders.com Advantage.
| Title: | Technical Writer |
| Company: | Technical Analysis, Inc. |
| Address: | 4757 California Avenue SW |
| Seattle, WA 98116 | |
| Phone # for sales: | 206 938 0570 |
| Fax: | 206 938 1307 |
| Website: | www.Traders.com |
| E-mail address: | DPenn@traders.com |
Traders' Resource Links | |
| Charting the Stock Market: The Wyckoff Method -- Books | |
| Working-Money.com -- Online Trading Services | |
| Traders.com Advantage -- Online Trading Services | |
| Technical Analysis of Stocks & Commodities -- Publications and Newsletters | |
| Working Money, at Working-Money.com -- Publications and Newsletters | |
| Traders.com Advantage -- Publications and Newsletters | |
| Professional Traders Starter Kit -- Software | |
Click here for more information about our publications!
Comments
Date: 11/04/05Rank: 3Comment:
Date: 11/17/05Rank: 5Comment:
Date: 11/22/05Rank: 5Comment:

|

Request Information From Our Sponsors
- VectorVest, Inc.
- Executive Premier Workshop
- One-Day Options Course
- OptionsPro
- Retirement Income Workshop
- Sure-Fire Trading Systems (VectorVest, Inc.)
- Trading as a Business Workshop
- VectorVest 7 EOD
- VectorVest 7 RealTime/IntraDay
- VectorVest AutoTester
- VectorVest Educational Services
- VectorVest OnLine
- VectorVest Options Analyzer
- VectorVest ProGraphics v6.0
- VectorVest ProTrader 7
- VectorVest RealTime Derby Tool
- VectorVest Simulator
- VectorVest Variator
- VectorVest Watchdog
- StockCharts.com, Inc.
- Candle Patterns
- Candlestick Charting Explained
- Intermarket Technical Analysis
- John Murphy on Chart Analysis
- John Murphy's Chart Pattern Recognition
- John Murphy's Market Message
- MurphyExplainsMarketAnalysis-Intermarket Analysis
- MurphyExplainsMarketAnalysis-Visual Analysis
- StockCharts.com
- Technical Analysis of the Financial Markets
- The Visual Investor
