HOT TOPICS LIST
- MACD
- Fibonacci
- RSI
- Gann
- ADXR
- Stochastics
- Volume
- Triangles
- Futures
- Cycles
- Volatility
- ZIGZAG
- MESA
- Retracement
- Aroon
INDICATORS LIST
LIST OF TOPICS
PRINT THIS ARTICLE
by Arthur Hill
The Kuala Lumpur Composite has a classic correction working, and the end of the decline could be at hand.
Position: Accumulate
Arthur Hill
Arthur Hill is currently editor of TDTrader.com, a website specializing in trading strategies, sector/industry specific breadth stats and overall technical analysis. He passed the Society of Technical Analysts (STA London) diploma exam with distinction is a Certified Financial Technician (CFTe). Prior to TD Trader, he was the Chief Technical Analyst for Stockcharts.com and the main contributor to the ChartSchool.
PRINT THIS ARTICLE
RETRACEMENT
Kuala Lumpur Composite Finds Support
11/03/05 03:44:59 PMby Arthur Hill
The Kuala Lumpur Composite has a classic correction working, and the end of the decline could be at hand.
Position: Accumulate
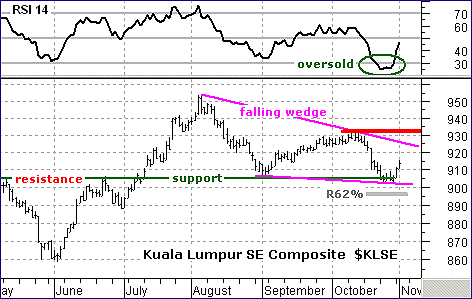
| Distinguishing between a corrective move and an impulse move is one of the hardest parts of technical analysis. However, both have certain specific characteristics, and we can use these to help distinguish corrections from impulse moves. Before a correction can even begin, there must be an impulse move that needs correcting. The index surged from 860 to 950 and recorded a new all-time high in early August. Big moves and new highs are certainly characteristics of an impulse move. |

|
| FIGURE 1: KUALA LUMPUR SE COMPOSITE. The RSI moved to oversold and bounced sharply over the long term. |
| Graphic provided by: MetaStock. |
| Graphic provided by: MS QuoteCenter. |
| |
| Now it is time to look at the correction. The current decline retraced 50-62% of the prior advance, formed a falling wedge, and returned to broken resistance. All three are characteristics of a correction. Broken resistance turned into support in early September and again in late October. In addition, note that the relative strength index (RSI) moved to oversold and bounced sharply over the last few days (Figure 1). |
| The impulse move is clear and the current decline looks like a correction. Now what? Traders can either pick a bottom near current levels or wait for a breakout. Picking a bottom near current levels offers a better risk-reward ratio, but also increases the chances of failure. A move above the upper trendline would be the first bullish signal, and further strength above the October high would signal a continuation of the prior advance. The upside target would be well north of 950. |
Arthur Hill is currently editor of TDTrader.com, a website specializing in trading strategies, sector/industry specific breadth stats and overall technical analysis. He passed the Society of Technical Analysts (STA London) diploma exam with distinction is a Certified Financial Technician (CFTe). Prior to TD Trader, he was the Chief Technical Analyst for Stockcharts.com and the main contributor to the ChartSchool.
| Title: | Editor |
| Company: | TDTrader.com |
| Address: | Willem Geetsstraat 17 |
| Mechelen, B2800 | |
| Phone # for sales: | 3215345465 |
| Website: | www.tdtrader.com |
| E-mail address: | arthurh@tdtrader.com |
Traders' Resource Links | |
| TDTrader.com has not added any product or service information to TRADERS' RESOURCE. | |
Click here for more information about our publications!
Comments
Date: 11/03/05Rank: 4Comment:
Date: 11/19/05Rank: 4Comment:

Request Information From Our Sponsors
- StockCharts.com, Inc.
- Candle Patterns
- Candlestick Charting Explained
- Intermarket Technical Analysis
- John Murphy on Chart Analysis
- John Murphy's Chart Pattern Recognition
- John Murphy's Market Message
- MurphyExplainsMarketAnalysis-Intermarket Analysis
- MurphyExplainsMarketAnalysis-Visual Analysis
- StockCharts.com
- Technical Analysis of the Financial Markets
- The Visual Investor
- VectorVest, Inc.
- Executive Premier Workshop
- One-Day Options Course
- OptionsPro
- Retirement Income Workshop
- Sure-Fire Trading Systems (VectorVest, Inc.)
- Trading as a Business Workshop
- VectorVest 7 EOD
- VectorVest 7 RealTime/IntraDay
- VectorVest AutoTester
- VectorVest Educational Services
- VectorVest OnLine
- VectorVest Options Analyzer
- VectorVest ProGraphics v6.0
- VectorVest ProTrader 7
- VectorVest RealTime Derby Tool
- VectorVest Simulator
- VectorVest Variator
- VectorVest Watchdog
