HOT TOPICS LIST
- MACD
- Fibonacci
- RSI
- Gann
- ADXR
- Stochastics
- Volume
- Triangles
- Futures
- Cycles
- Volatility
- ZIGZAG
- MESA
- Retracement
- Aroon
INDICATORS LIST
LIST OF TOPICS
PRINT THIS ARTICLE
by Koos van der Merwe
With oil and gas prices this high, this is definitely a share to watch.
Position: Hold
Koos van der Merwe
Has been a technical analyst since 1969, and has worked as a futures and options trader with First Financial Futures in Johannesburg, South Africa.
PRINT THIS ARTICLE
STOCHASTICS
A Cheapie In CanWest Petroleum Corp.?
11/03/05 01:46:25 PMby Koos van der Merwe
With oil and gas prices this high, this is definitely a share to watch.
Position: Hold
| CanWest Petroleum has been in the news of late, with the largest land holdings in the Athabasca Oil Sands region, the 846,680 acres known as the Firebag East project. Also in the Athabasca Oil Sands, CanWest has 3.4 billion barrels of bitumen oil resource, known as the Eagle Nest Project, and a 4.3 billion barrels of oil shale resource, known as the Pasquia Hills Project, which contain petrochemical feedstocks including benzenes and naphthas. Not only that, a senior US listing is planned in the near term. |
| So what does this all mean? The share is speculative -- in other words, full of hope that they will succeed -- and a large number of speculators are taking the plunge, simply because the odds are better than what you get at Las Vegas. However, what do the charts tell us? |

|
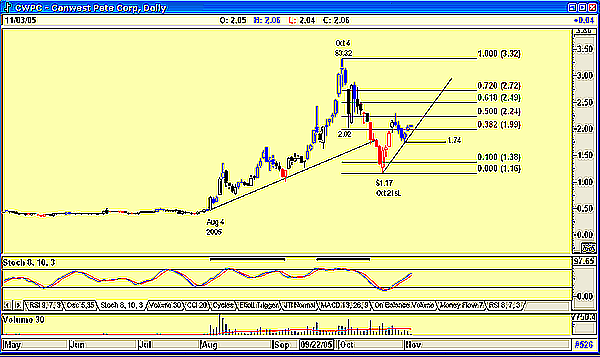
| FIGURE 1: CANWEST PETROLEUM. Is it a buy? |
| Graphic provided by: AdvancedGET. |
| |
| As you can see in Figure 1, the share pottered around the $0.40 level for ever so long, and then without warning, it suddenly took off and moved from a low of $0.48 to a high of $0.73. Two days before this jump, volume started exceeding the average volume -- the red line shown on the volume. I use a 30-period moving average of the volume, and will use this as an early warning of something possibly about to happen. This indicator is especially valuable in dormant shares, and when combined with a stochastic that is close to or below the 20 level, can be informative. On October 4 at $3.32, the price peaked and suggested a sell signal with a long-legged doji formation. This type of doji is a signal of indecision in the market at tops, and may lead to a reversal soon after its emergence. The share price dropped abruptly over two days to $2.02, recovered 61.8% of the fall to $2.89, and promptly fell again to a low of $1.17 on October 21. This coincided with a fall in the stochastic to below the 20 level, suggesting that the share price could be oversold. |
| The stochastic then gave a buy signal, with the price making a 50% retracement to $2.20 before falling to $1.74. At the moment the price is on the rise, with a pivot point resistance at $2.20. Should it break this level, and the stochastic suggests that this is possible, then the share becomes a buy. Will the price reach the high level of $3.32? This is possible, but the falling volume as the price increased the past few days suggests otherwise; however, the company is drilling "holes of hope," and they may just strike it lucky. With oil and gas prices this high, definitely a share to watch. |
Has been a technical analyst since 1969, and has worked as a futures and options trader with First Financial Futures in Johannesburg, South Africa.
| Address: | 3256 West 24th Ave |
| Vancouver, BC | |
| Phone # for sales: | 6042634214 |
| E-mail address: | petroosp@gmail.com |
Click here for more information about our publications!
Comments
Date: 11/03/05Rank: 2Comment:
Date: 11/19/05Rank: 4Comment:

Request Information From Our Sponsors
- StockCharts.com, Inc.
- Candle Patterns
- Candlestick Charting Explained
- Intermarket Technical Analysis
- John Murphy on Chart Analysis
- John Murphy's Chart Pattern Recognition
- John Murphy's Market Message
- MurphyExplainsMarketAnalysis-Intermarket Analysis
- MurphyExplainsMarketAnalysis-Visual Analysis
- StockCharts.com
- Technical Analysis of the Financial Markets
- The Visual Investor
- VectorVest, Inc.
- Executive Premier Workshop
- One-Day Options Course
- OptionsPro
- Retirement Income Workshop
- Sure-Fire Trading Systems (VectorVest, Inc.)
- Trading as a Business Workshop
- VectorVest 7 EOD
- VectorVest 7 RealTime/IntraDay
- VectorVest AutoTester
- VectorVest Educational Services
- VectorVest OnLine
- VectorVest Options Analyzer
- VectorVest ProGraphics v6.0
- VectorVest ProTrader 7
- VectorVest RealTime Derby Tool
- VectorVest Simulator
- VectorVest Variator
- VectorVest Watchdog
